
Disclaimer: The opinions expressed by our writers are their own and do not represent the views of U.Today. The financial and market information provided on U.Today is intended for informational purposes only. U.Today is not liable for any financial losses incurred while trading cryptocurrencies. Conduct your own research by contacting financial experts before making any investment decisions. We believe that all content is accurate as of the date of publication, but certain offers mentioned may no longer be available.

Even though the price of XRP is still stuck close to the psychologically significant $1 level, it may be creating one of its first significant bullish momentum signals in weeks. While the overall trend is still clearly negative, a divergence between XRP's price action and the Relative Strength Index indicates that bearish momentum is waning.
It's getting worse for XRP
After hitting another local low in August, XRP is currently trading at about $1.006. A series of lower lows has resulted from the price's continued decline following its July rebound. But the RSI is acting in a different way. The daily RSI has started to rise rather than confirm those new price lows with deeper momentum lows. The indicator is currently close to 39, and its recent lows have generally increased.
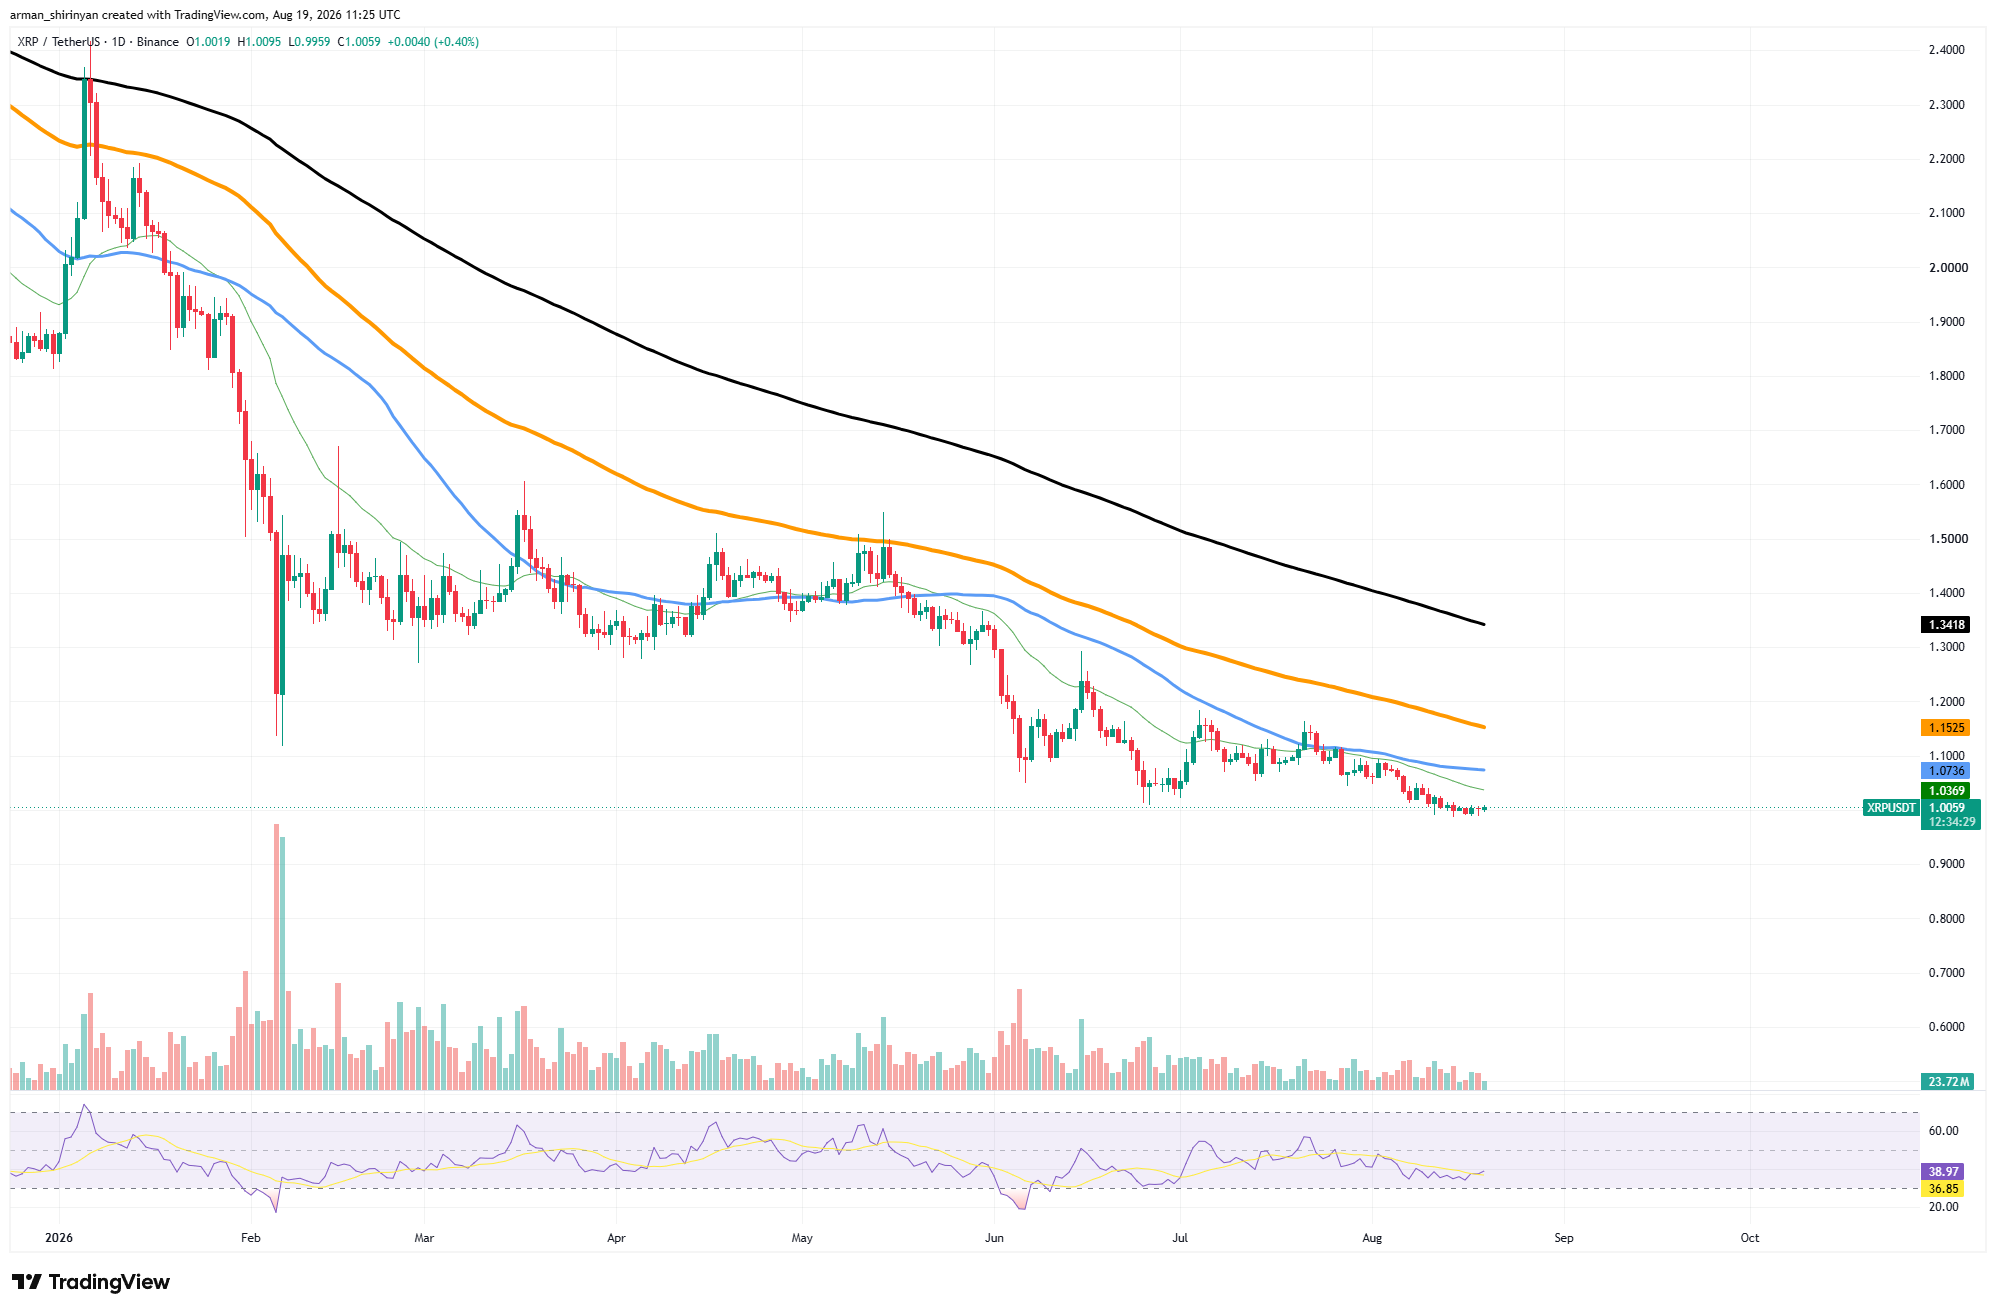
As a result, there may be a bullish RSI divergence as the price declines and the downward momentum gradually weakens. When sellers maintain control but weaken, such divergences frequently occur.
They do not promise an instant reversal. Before the divergence results in any discernible price reaction, XRP may continue to decline or consolidate close to current levels. That distinction is particularly crucial because of the moving-average structure. Every significant average displayed on the chart is still above XRP. The blue average is close to $1.07, and immediate resistance is at $1.04.
Key threshold surpassed
The long-term average is much higher at about $1.34, but there is still more significant resistance around $1.15. Another intriguing component is provided by network activity. In early August, the number of XRP Ledger transactions surged to three million per day, and in August, it surpassed two million once more.

Although activity has since decreased, the network has handled more than one million transactions every day for the majority of the last month. The price of XRP must react for the RSI divergence to receive technical confirmation. While regaining $1.07 would strengthen the case that momentum divergence is translating into actual demand, a recovery above $1.04 would be an initial improvement.
It is still possible for the opposite to occur. The immediate stabilization attempt would be invalidated and XRP would be vulnerable to further price discovery below its recent lows if there were a clear breakdown below $1. For the time being, the divergence serves as a warning not to assume that XRP's decline will continue at the same rate. Although momentum suggests that sellers' advantage is starting to wane, sellers are still in control.
 Dan Burgin
 U.Today Editorial Team
