Disclaimer: The opinions expressed by our writers are their own and do not represent the views of U.Today. The financial and market information provided on U.Today is intended for informational purposes only. U.Today is not liable for any financial losses incurred while trading cryptocurrencies. Conduct your own research by contacting financial experts before making any investment decisions. We believe that all content is accurate as of the date of publication, but certain offers mentioned may no longer be available.
After one of the biggest drops of the year, XRP might have finally reached a local bottom.
Recently, the asset broke below a multi-month support zone around $1.30, which set off a selling frenzy that drove the price toward the $1.05-$1.10 range. But since then, things have begun to level off. XRP has spent several sessions consolidating above recent lows rather than falling further, drawing enough buying pressure to avert another significant breakdown.
When you look at the daily chart, the failed continuation lower is the first thing you notice. Bears had a clear chance to drive XRP below the psychological $1 mark following the support breakdown. They haven't been successful thus far.
Will XRP hold the pressure?
The trend hasn't changed as a result of this. The 50-day moving average is currently close to $1.24, but the 100-day and 200-day moving averages are still much higher. The overall trend is still negative as long as the price remains below those levels.
Momentum indicators, however, indicate that the worst of the selling pressure might already have passed. During the recent decline, the RSI fell into oversold territory and is now beginning to level out. In the past, this kind of behavior frequently coincides with the development of a temporary bottom rather than the start of another aggressive leg lower.
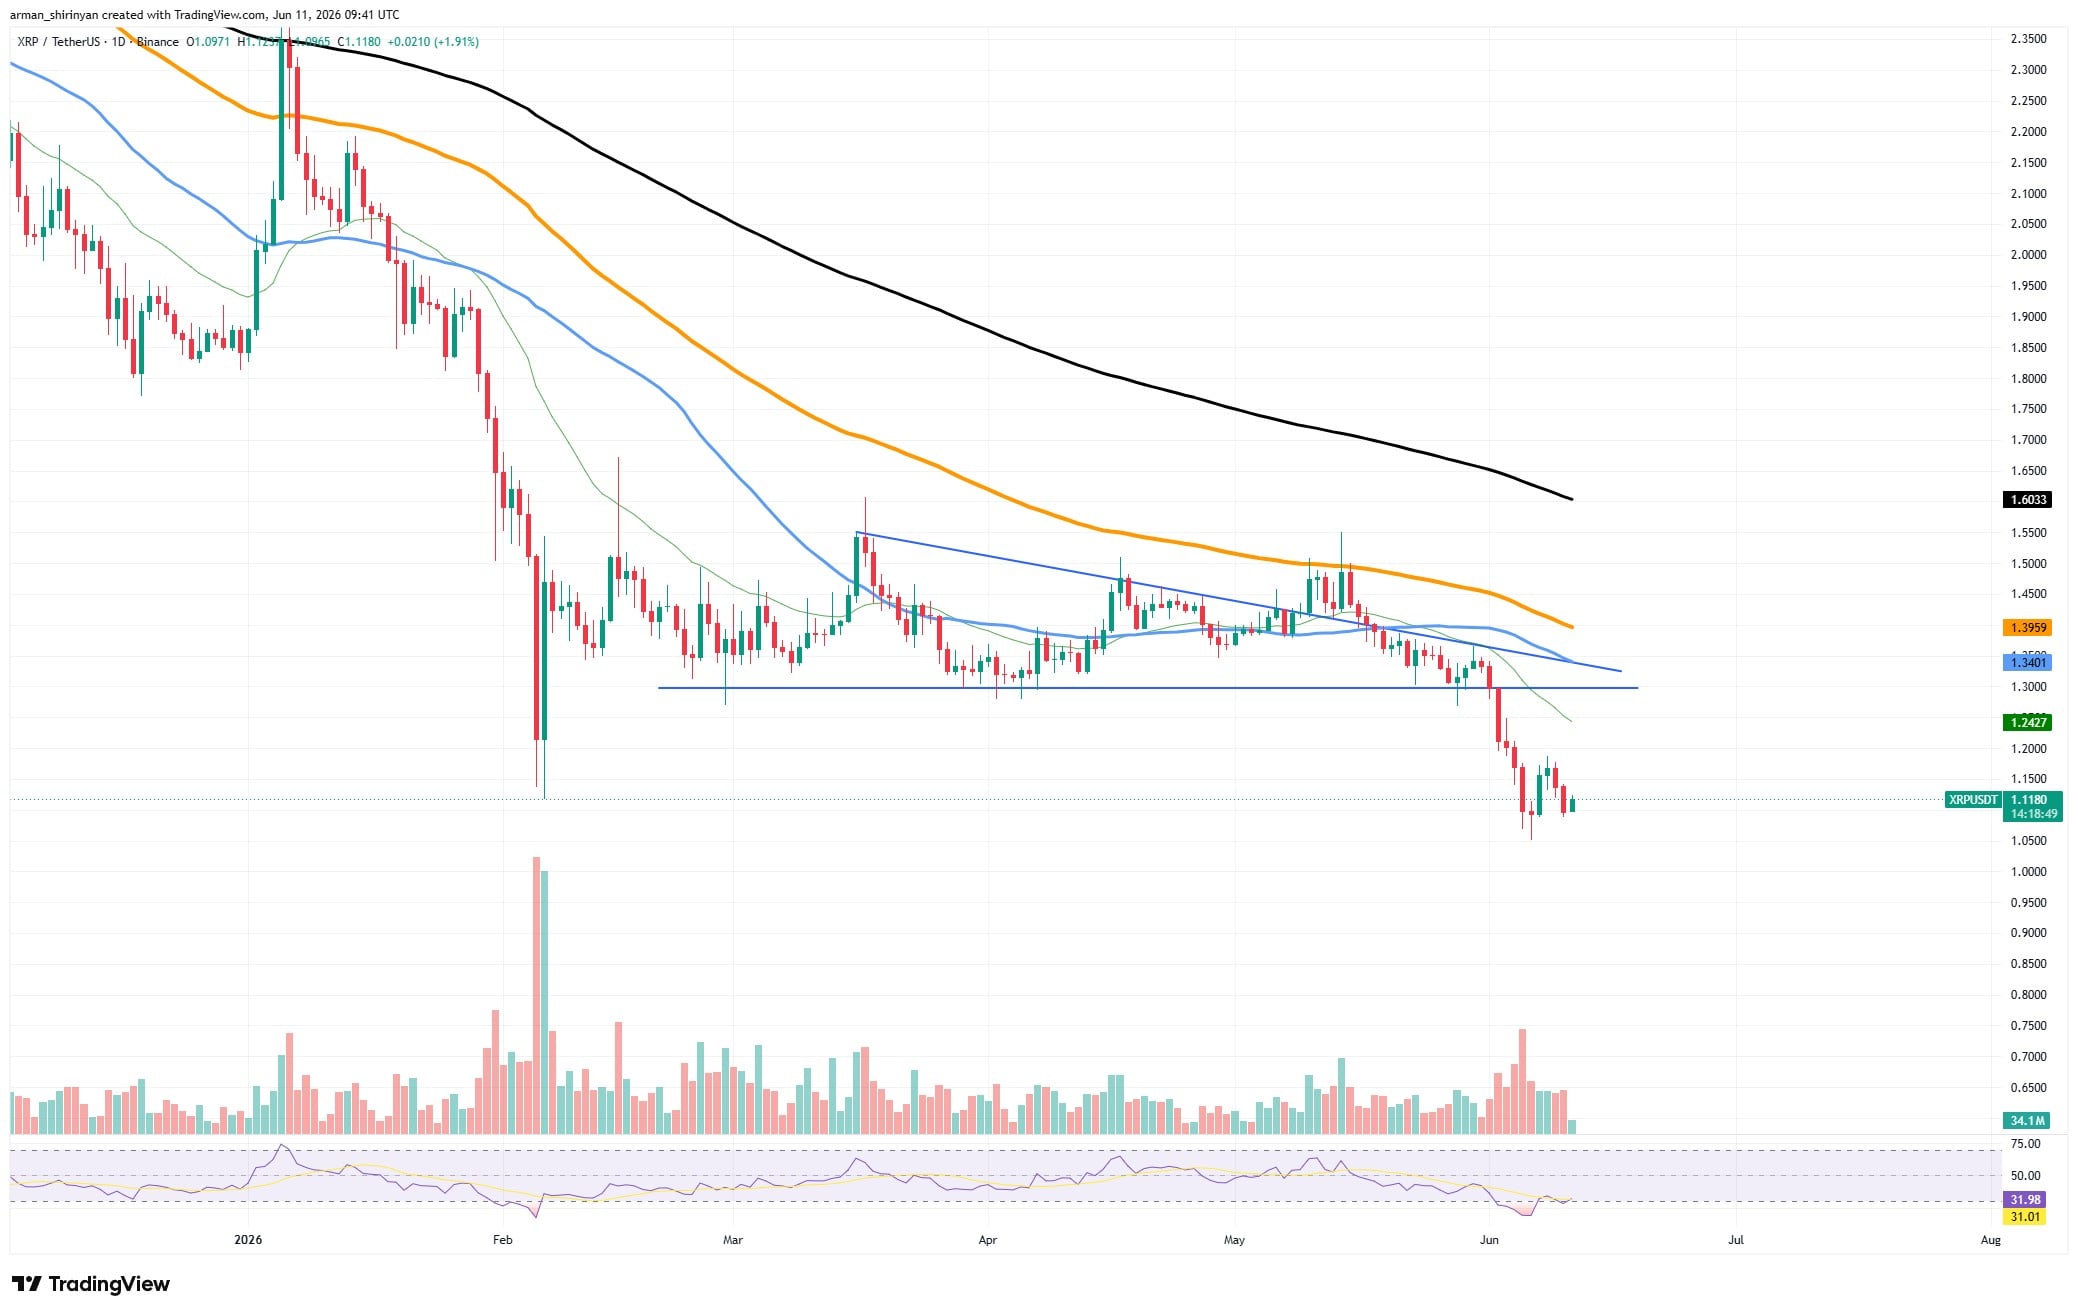
The stabilization thesis is further supported by volume. The highest trading activity occurred during the actual sell-off, indicating panic liquidation and forced selling. Volume started to decline after those positions were cleared, and the price stopped reaching new lows.
What should traders anticipate?
A consolidation phase between approximately $1.05 and $1.25 is the most likely scenario. Markets seldom transition immediately from panic selling to a new bull trend. Rather, they typically invest time in creating a foundation while buyers and sellers find a new balance.
The former support zone around $1.30 presents the first significant obstacle for XRP bulls. Regaining that level would be a crucial indication that buyers are taking back control and that the breakdown was overstretched. Resistance appears around the 50-day and 100-day moving averages above that.

The level on the downside is still clearly $1. A clean break below it would refute the bottoming thesis, leaving XRP vulnerable to yet another selling wave.
As of right now, XRP seems to have found a floor. The question is not whether the panic phase is coming to an end, but whether buyers are strong enough to transform stabilization into a significant recovery.
 Dan Burgin
 U.Today Editorial Team