
Disclaimer: The opinions expressed by our writers are their own and do not represent the views of U.Today. The financial and market information provided on U.Today is intended for informational purposes only. U.Today is not liable for any financial losses incurred while trading cryptocurrencies. Conduct your own research by contacting financial experts before making any investment decisions. We believe that all content is accurate as of the date of publication, but certain offers mentioned may no longer be available.
One of the most significant psychological levels in XRP's recent history is getting perilously close. The asset is currently trading close to $1.12, with sellers still in control after losing support around $1.30 and completing a bearish breakdown from a multi-month descending triangle.
The straightforward question that many traders are posing is: what would happen if XRP fell below the $1 mark?
The most recent breakdown has been crucial based on the chart. In addition to falling below the horizontal support zone that was in place from March to May, XRP is still below all significant moving averages.
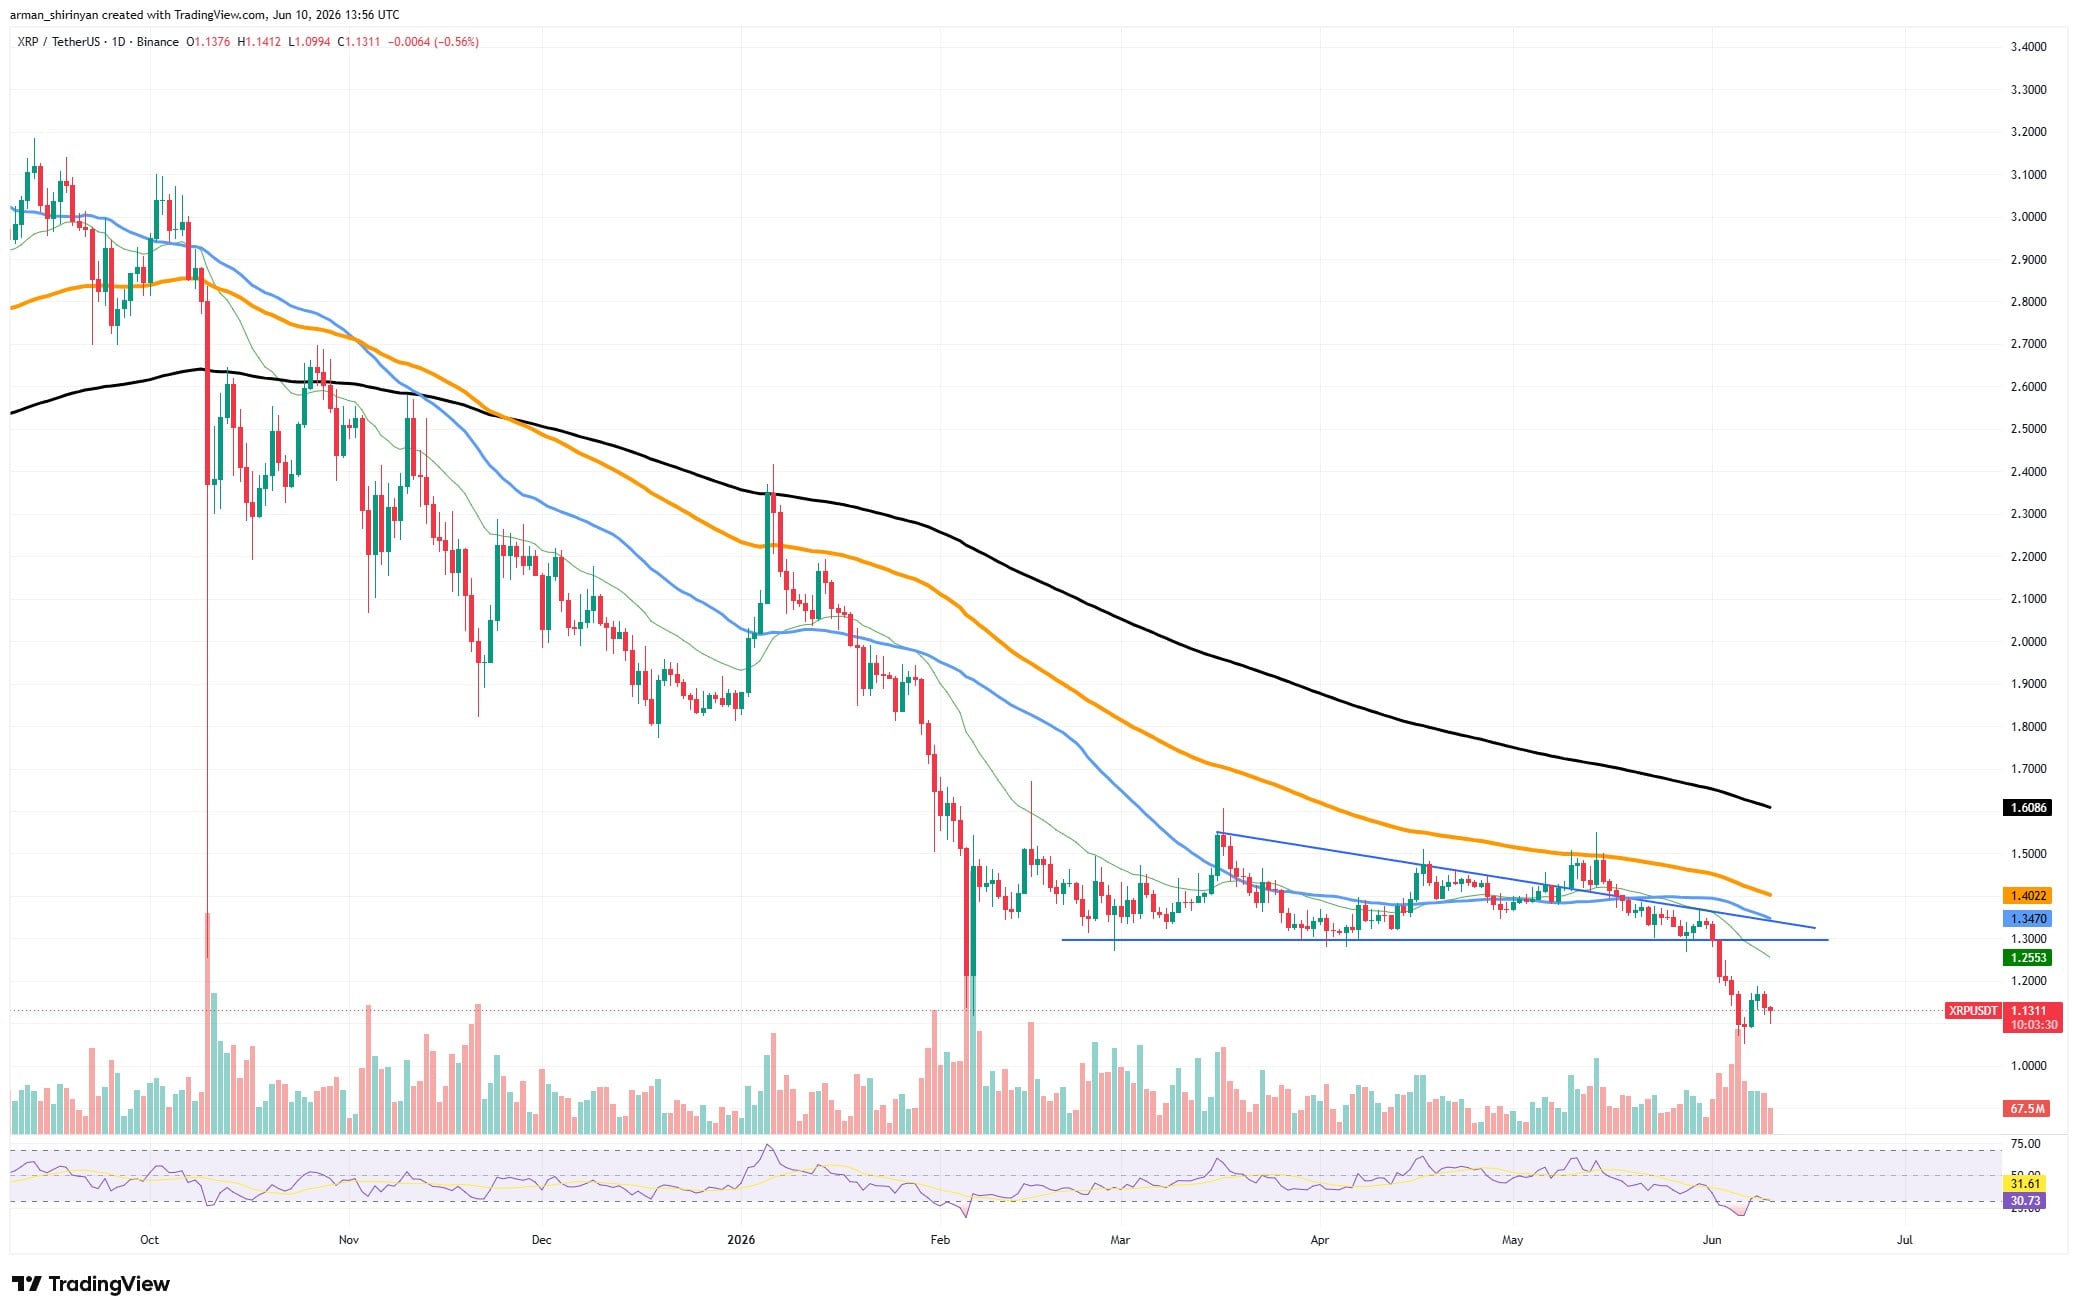
Nor is momentum. XRP is now in oversold territory since the daily RSI has dropped below 30. Although relief rallies frequently result from this oversold condition, by itself it does not halt downtrends. When there is a lot of pressure to sell, assets may stay oversold for a long time.
If XRP drops below $1, the market will probably move into a new phase that is influenced by both technical and psychological factors. Round-number levels typically draw a lot of interest from investors and traders. If there is a clear break below $1, more stop-loss orders may be placed, and some market players may be forced to reconsider their positions.
However, the next significant support zone becomes much less clear if the $1 level is not maintained. Although there isn't a clear technical structure on the current chart that ensures support right below current prices, buyers have historically been drawn to the region between about $0.90 and $1.00.
$1 is still the cutoff point for the time being. A relief rally back toward the $1.25–$1.30 area might be triggered by a successful defense. If it were not held, the current bearish trend would probably continue and volatility would rise.
Even though the market is already extremely oversold, buyers are still in a reactive rather than controlling position until XRP reclaims important resistance levels.
Ethereum's higher low has been formed
After weeks of unrelenting declines, Ethereum might be exhibiting the first significant indication that selling pressure is starting to lessen. After a sharp drop that drove ETH from the $2,300 area to $1,500, buyers eventually intervened and were able to stop another breakdown. This could lead to the market's first higher low, which is a technical development that traders frequently look for when searching for early reversal signals.
Ethereum recently printed a sharp sell-off candle on the daily chart, briefly pushing the price below $1,500 before drawing buyers right away. Since then, ETH has stabilized around $1,600 and, instead of continuing its vertical decline, is trying to establish a base.

Even though the change is tiny, it is significant. Ethereum continuously produced lower highs and lower lows during the entire decline. Overall, that structure is still in place, but the recent bounce indicates that sellers are no longer in total control. The initial step required to eventually construct a more significant trend reversal would be a higher low.
Additionally, volume conveys an intriguing tale. The recent capitulation move was accompanied by the highest trading activity in months, indicating that panic selling and substantial liquidation took place close to local lows. These incidents frequently indicate the exhaustion stage of a decline, but they do not ensure a quick recovery.
But there are still significant challenges for bulls. Ethereum is still below its 50-, 100-, and 200-day moving averages, which are grouped around $1,900 and $2,400. During any attempt at recovery, these levels will probably act as resistance. Additionally, the declining trendline that limited price movement in May hasn't been completely disproved.
As of right now, the most significant development is straightforward: Ethereum has ceased to create new lows. Although a confirmed higher low is frequently the first technical indication that the market structure is starting to change, it does not imply that the downtrend is over.
Cardano's upside is completely gone
A large portion of the speculative excess accumulated during Cardano's prior rally seems to have been entirely eliminated at this point. ADA eventually broke down and lost one of the most significant levels on its daily chart after months of consolidating above the $0.20-$0.22 support area.
The asset reached $0.16, a level not seen since the beginning of its most recent significant increase, as a result of the move, which set off a strong wave of selling pressure.

Technically speaking, the chart appears severely damaged. ADA is trading significantly below its 50-day, 100-day, and 200-day moving averages, all of which are still declining. A multi-month support zone that kept the market stable in March, April, and May was also rendered invalid by the most recent breakdown.
As soon as that floor gave way, sellers seized power. The magnitude of the decline, however, is what makes the current situation intriguing. Cardano is in extremely oversold territory, as the Relative Strength Index has fallen close to 22.
In the past, readings at these levels have typically occurred during panic episodes, when traders rush to sell their positions at any price. Oversold conditions frequently indicate that downward momentum is getting stretched, even though they do not by themselves ensure a rebound.
Volume is consistent with this interpretation. Instead of a slow decline, the recent sell-off caused one of the biggest trading spikes in months, indicating capitulation activity. When a sharp breakdown is accompanied by large volume, it usually means that weaker holders are pulling out of the market.
Major bottoms frequently don't start to form until after this kind of widespread market reset. Bulls' issue is that recovery is still only hypothetical at this point. The first resistance zone is currently located around $0.21, while the 100-day and 50-day moving averages are currently located between $0.24 and $0.25.
 Dan Burgin
 U.Today Editorial Team