Another wave of selling occurred over the weekend, and the market cap decreased to 115 billion USD before recovering to 129 billion USD. Ethereum slid below the key $100 mark for a low of $98.04 on Kraken, with other exchanges listing slightly different prices. The new drop wasn’t caused by any apparent reason other than panic dumping and an overall negative sentiment surrounding cryptocurrency in general.
Ethereum’s daily volume ($2.2 billion) surpasses both Ripple and Bitcoin Cash combined, and although it has dropped in third place for quite a few days now, it’s clear there is still interest for this cryptocurrency, which may lead to a bullish recovery.
Charts at a Glance – ETH/USD

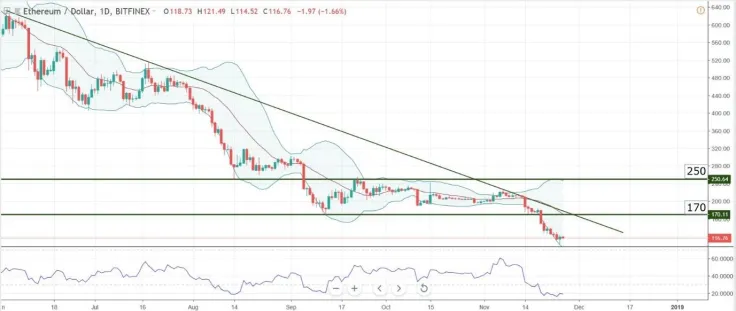
The daily chart above is showing a solid downtrend, with ETH trading at $116 at the time of writing for a 27.80% drop over the last 7 days and a small 6% climb during the last 24 hours. Currently, there are no clear signs of trend reversal, but there are signs of a pause in bearish movement and possible retracements higher.
The Relative Strength Index is oversold for a few days on the daily chart (more important than lower time frame charts). The bearish (red) candles have become smaller and with wicks in both their upper and lower sides (sign of indecision), and the pair has rebounded from the key handle at $100, which is a very strong psychological level.
The main upper target for a potential retracement is the bearish trend line that has capped the pair for the last few months, as well as the technical level at $170. The overall bias remains bearish but retracements higher are a distinct possibility.
Support zone: 100
Resistance zone: 130 - 140 (previous long-term support – see weekly charts) and 170
Most likely scenario: retracements towards the bearish trend line
Alternative scenario: drop through 100 without retracement
 Tomiwabold Olajide
 Caroline Amosun