

Disclaimer: The opinions expressed by our writers are their own and do not represent the views of U.Today. The financial and market information provided on U.Today is intended for informational purposes only. U.Today is not liable for any financial losses incurred while trading cryptocurrencies. Conduct your own research by contacting financial experts before making any investment decisions. We believe that all content is accurate as of the date of publication, but certain offers mentioned may no longer be available.

Zcash cools off quickly
After failing to maintain its recent rally toward the $570 region, Zcash has entered a cooling-off phase. Sellers intervened close to local highs after a strong, impulsive move earlier in July, forcing ZEC into a controlled pullback that has since returned the asset to its short-term moving averages. The larger technical structure is still beneficial even after the correction.
While the 200-day EMA (black) is still trending upward well below the current price action, ZEC is still trading above the 100-day and 200-day moving averages. The medium-term bullish structure holds true as long as the asset stays above the $460-470 support area. The 50-day EMA, which served as dynamic support during the recent rise, has begun to flatten.
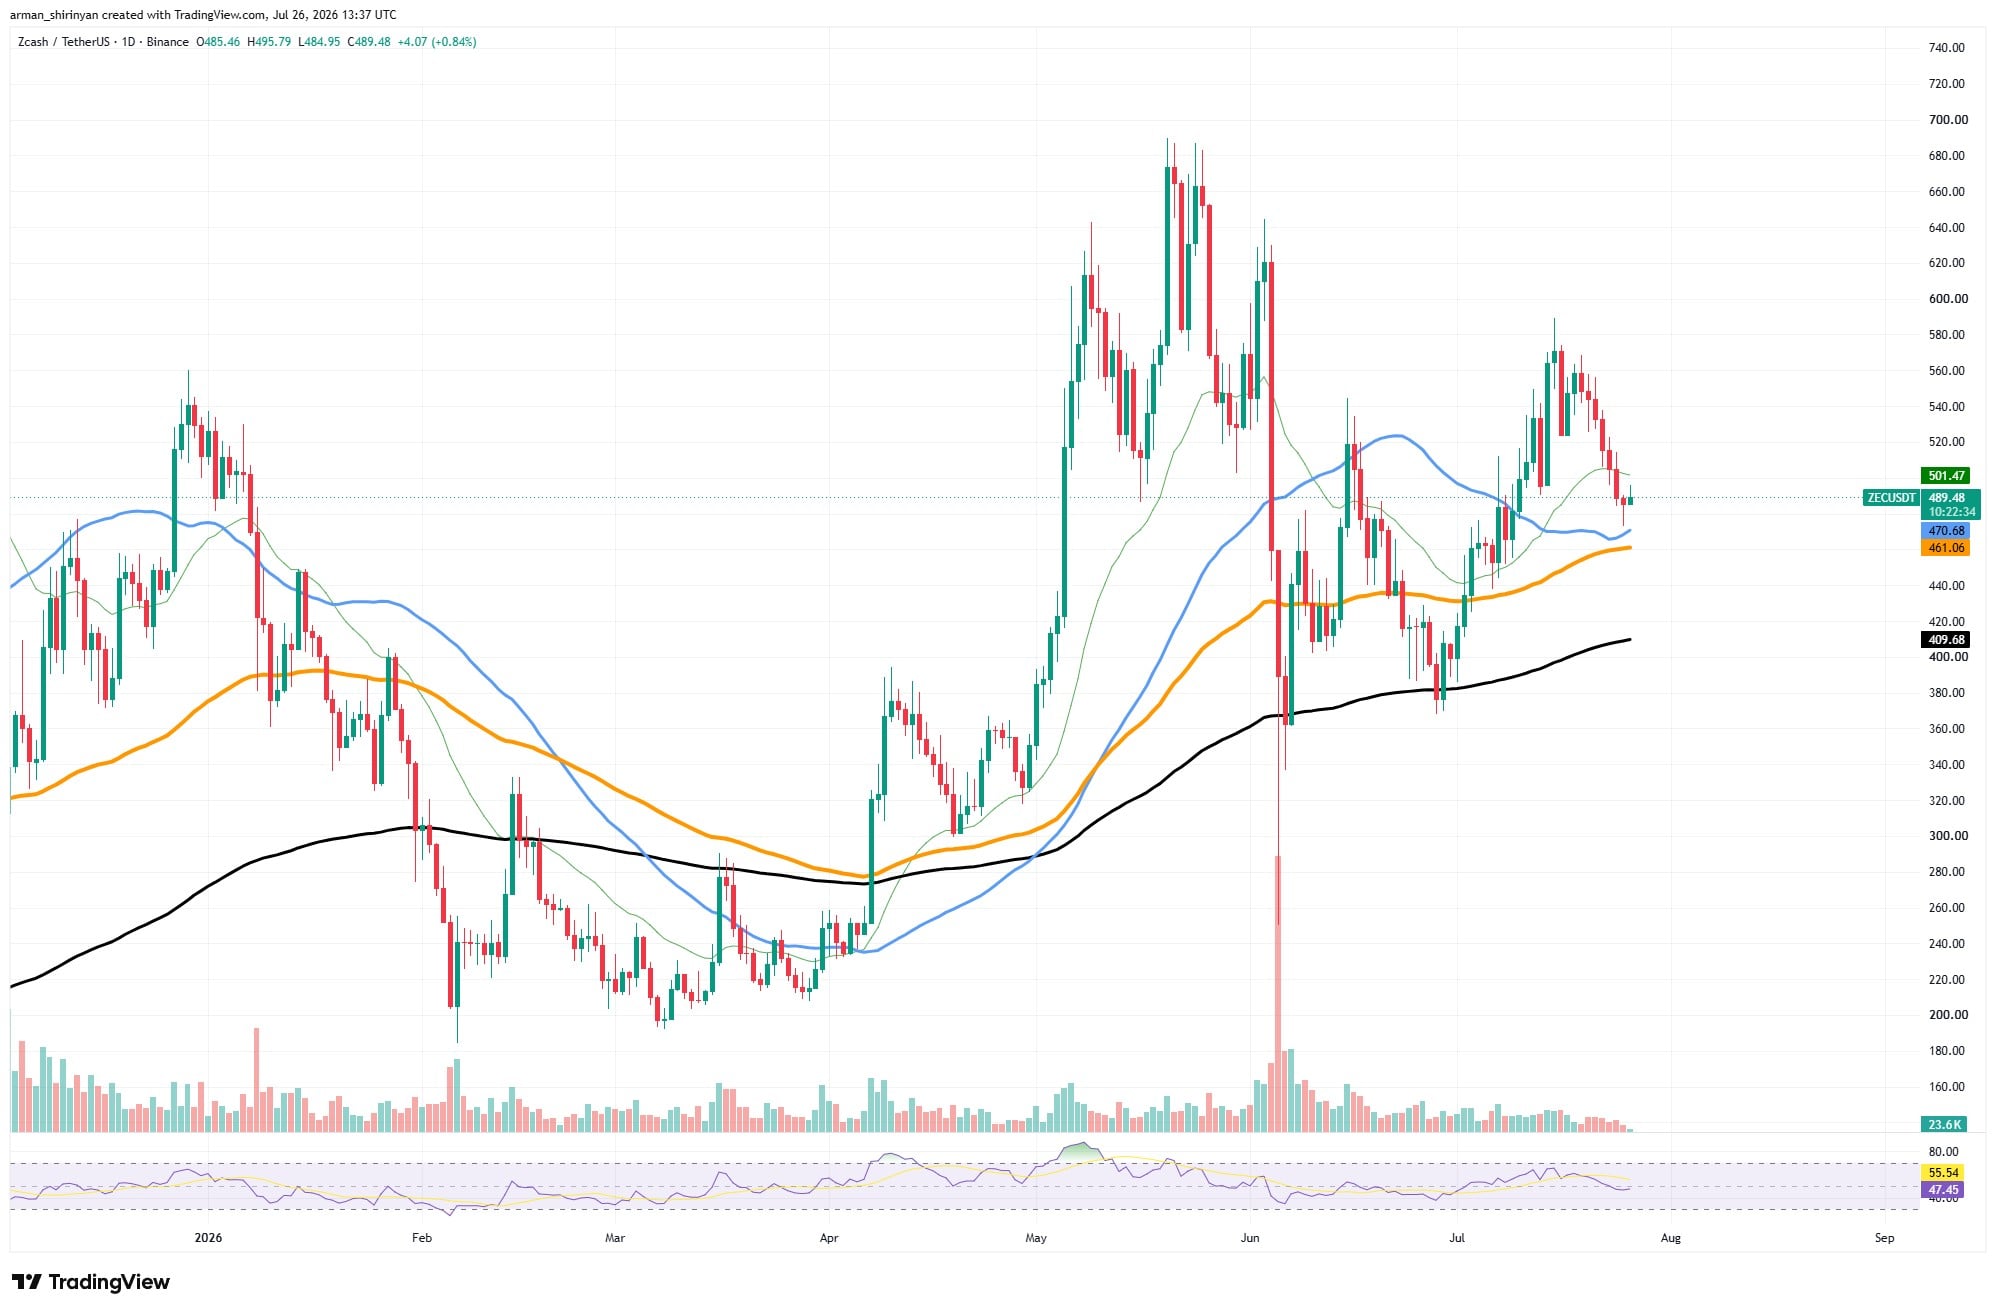
The first crucial test for purchasers is the price, which is currently hovering around that level. Before bulls challenge the $550-570 resistance zone once more, a successful defense here might lead to another attempt toward the $500 psychological barrier. But volume conveys a more circumspect narrative.
During the most recent decline, trading activity has steadily decreased, indicating that neither buyers nor sellers are currently very confident. In contrast to the explosive breakout that occurred earlier this month, lower volume during a correction is generally healthier than aggressive selling, but it also suggests that momentum has diminished. The RSI is currently close to the neutral 50 level after cooling considerably as well.
By doing this, the overbought conditions that accompanied the prior rally are eliminated, thereby restarting momentum. A move below 45 could indicate that bearish pressure is starting to take over, while a bounce from current RSI levels would support the argument for trend continuation. For the time being, it seems that Zcash is going through a typical consolidation rather than a trend reversal.
The long-term moving averages are still pointing upward, and the series of higher lows that have been in place since April is still in place. Bulls must, however, recover $500 rather quickly in order to rebuild confidence. If ZEC were to lose the $460 support cluster, it would probably be exposed to a deeper retracement toward the rising 200-day moving average close to the $410 area, where stronger long-term buyers might intervene once more.
XRP remains compressed
As the price of XRP continues to compress inside a symmetrical triangle that has formed throughout July, the cryptocurrency is getting close to a crucial technical moment. Volatility has significantly decreased after a few weeks of lower highs and higher lows, indicating that a clear breakout might not be far off.
As of this writing, XRP is trading at approximately $1.09, testing the descending resistance created by recent swing highs while remaining slightly above the rising support trendline. Following months of persistent downward pressure, buyers and sellers are becoming less certain, as evidenced by the narrowing price action. The larger trend is still difficult.
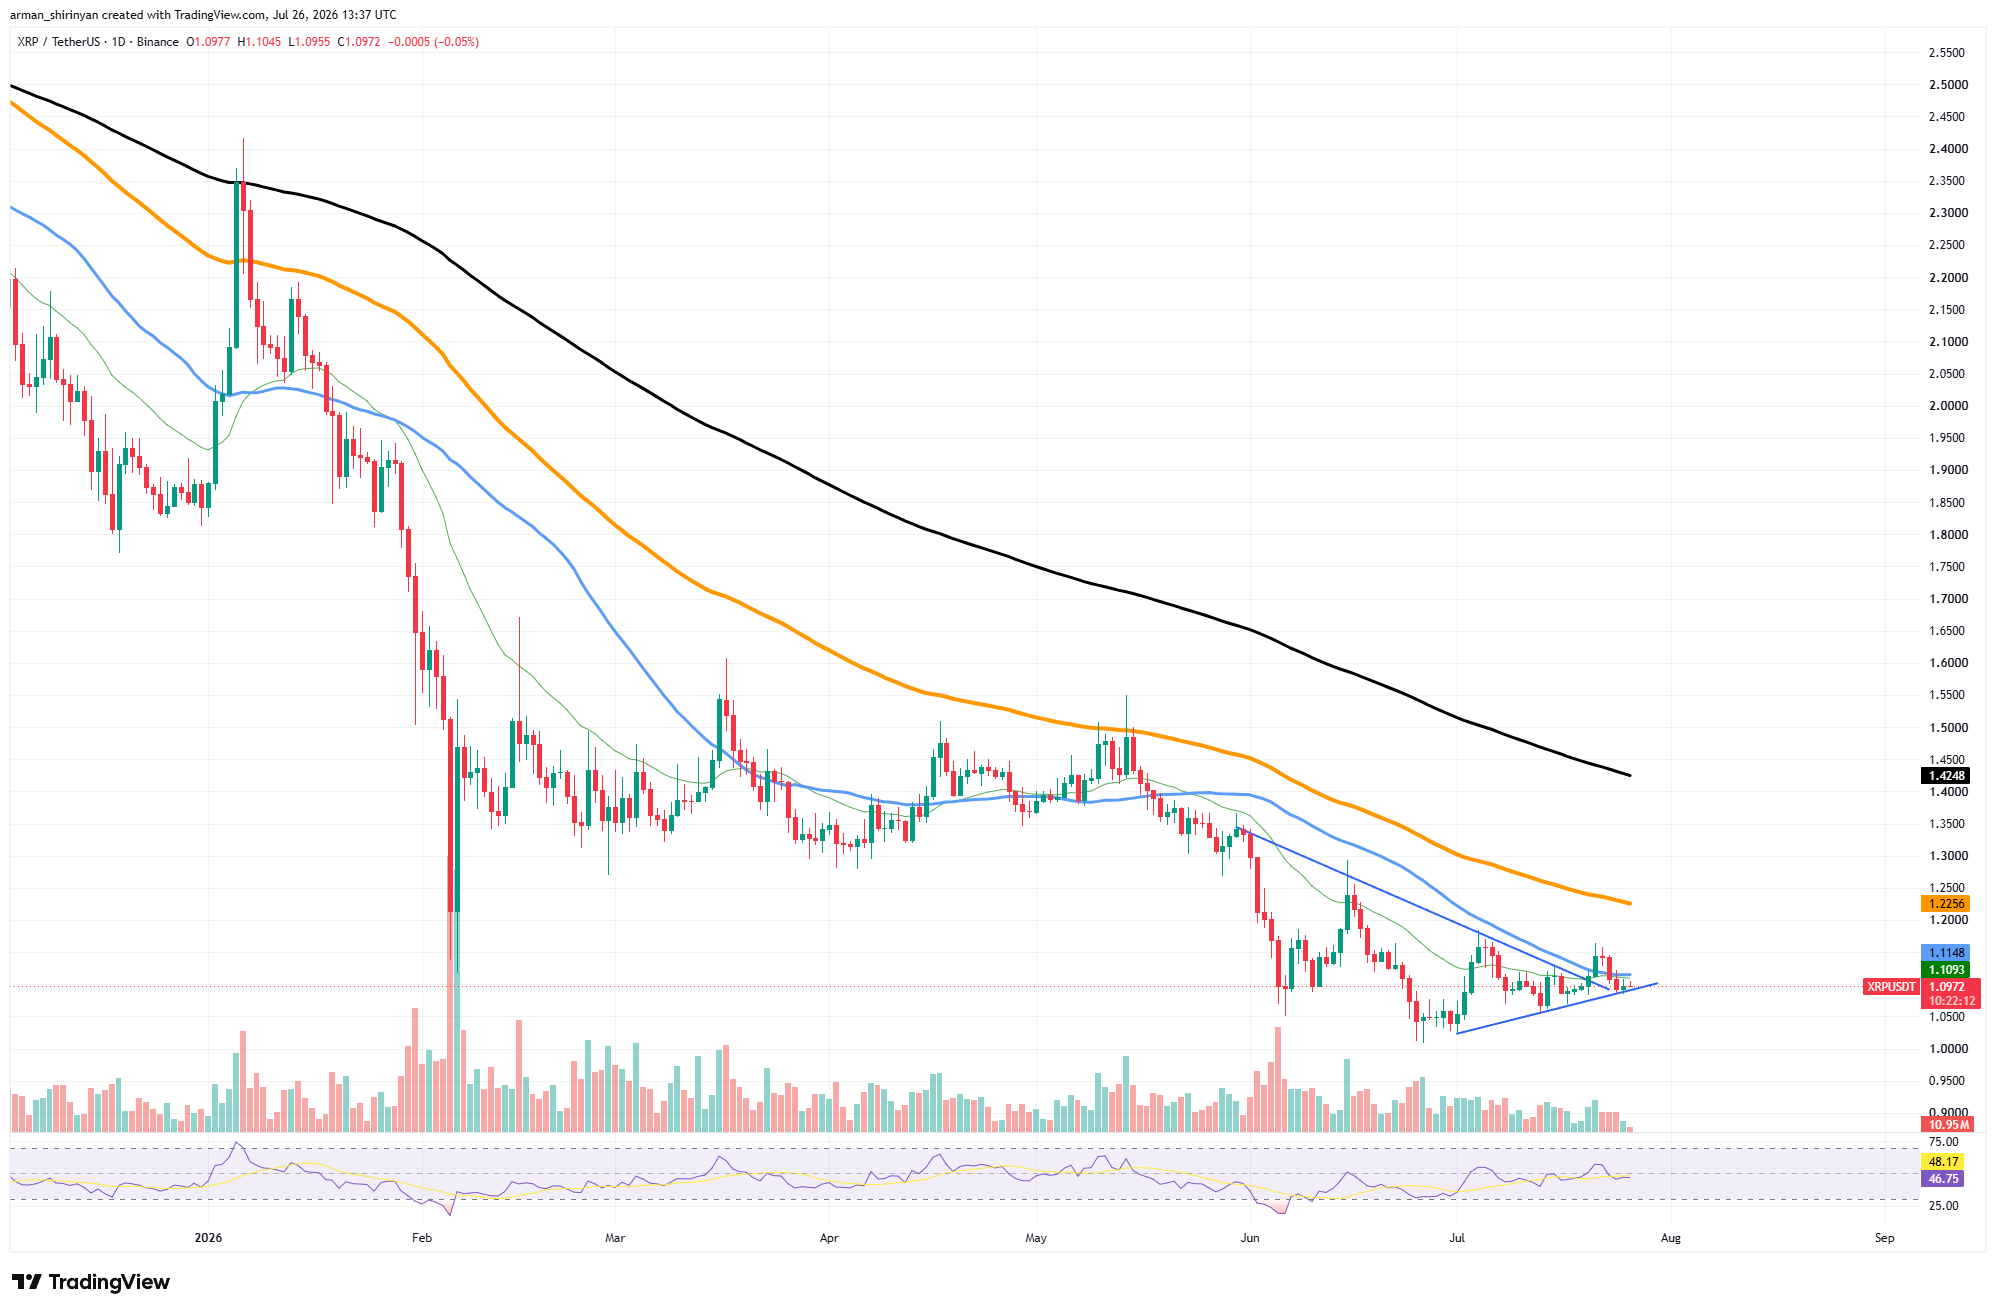
All of the major moving averages, such as the 100-day, 200-day, and long-term 200-day EMA, which are still sloping lower, are still below XRP. This indicates that despite the recent stabilization, the general macro trend is still bearish. Before bulls could seriously target the $1. 22 area, any breakout to the upside would need to overcome the nearby moving-average cluster around $1.11-$1.14.

Positively, momentum indicators have started to level out. After recovering from oversold conditions, the RSI now oscillates around the neutral 48 level, suggesting that selling pressure has subsided. Even though this isn't a bullish signal yet, it allows buyers to gain momentum in the event that resistance eventually breaks.
As is common with consolidation patterns, volume has steadily decreased during the triangle formation. Once the price leaves the current range, traders should keep a close eye out for a notable increase in volume, which would significantly increase the breakout direction's dependability.
Short-term bullish momentum would probably be triggered by a confirmed close above the declining trendline, which might also disprove the recent run of lower highs. The next significant level to keep an eye on is psychological support at $1.00, as failing to maintain the rising support would expose XRP to fresh selling pressure.
Shiba Inu spikes up
In a single session, Shiba Inu surged by almost 15% and broke through several significant technical barriers, delivering one of its best daily performances in weeks. SHIB finally attracted aggressive buying pressure after consolidating near yearly lows for the majority of July.
This resulted in a sharp bullish candle and a significant increase in trading volume. Because it propelled the token above the 50-day and 100-day moving averages nearly simultaneously, the breakout is technically significant. Regaining those levels reverses the short-term momentum in favor of buyers because they had served as dynamic resistance during the protracted decline.
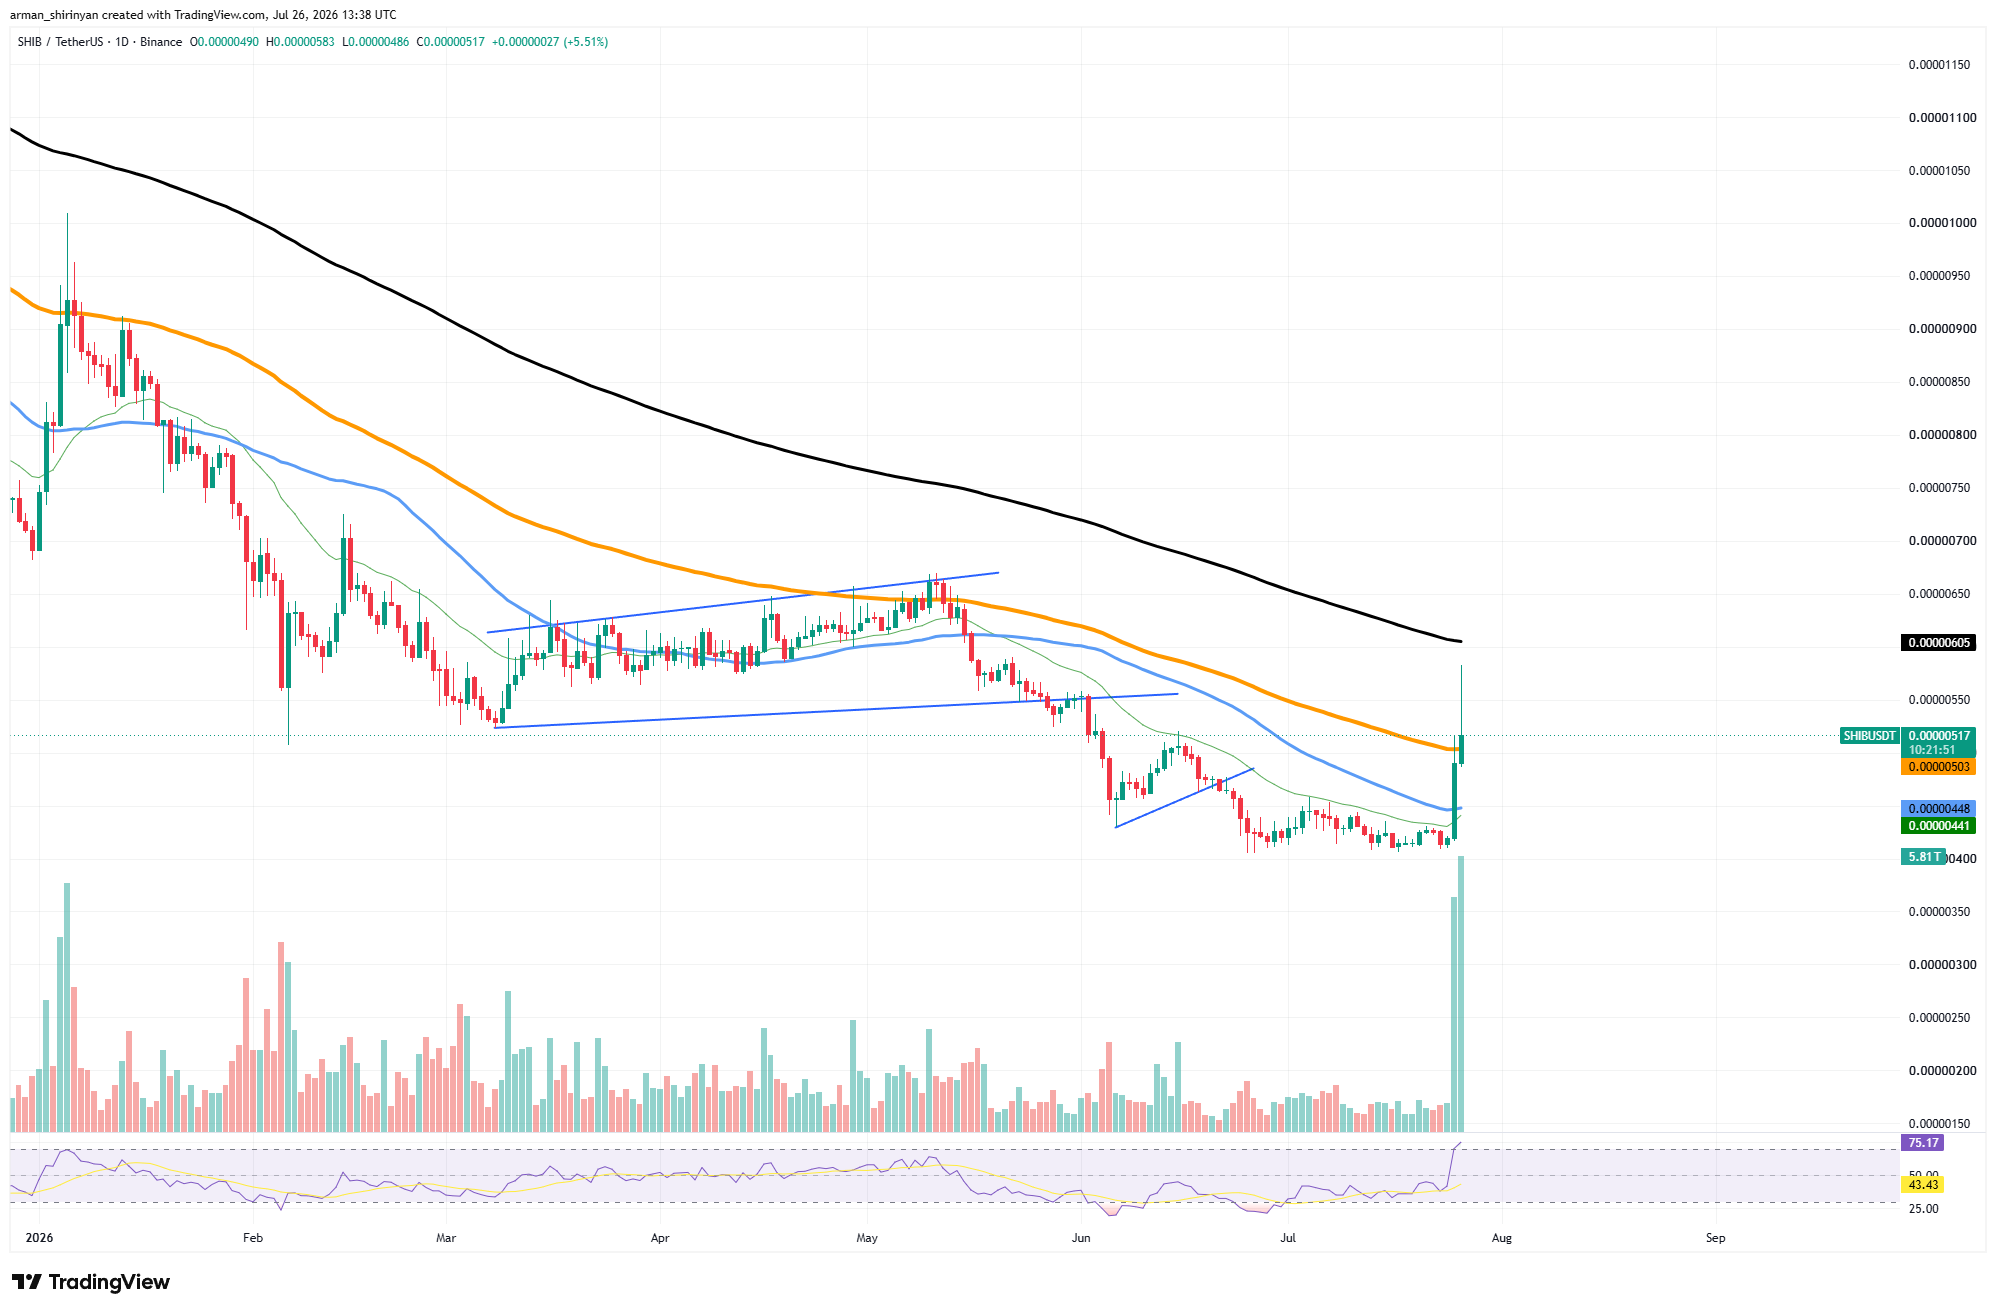
Additionally, the price is testing the 200-day moving average in the vicinity of $0.0000059-$0.0000060, which is currently the next significant barrier before a more significant trend reversal can be verified. The story that volume conveys is equally significant. In contrast to a low-liquidity squeeze, the most recent candle shows the highest trading activity in months, indicating real market participation. When a breakout is accompanied by strong volume, the likelihood that the move will last longer than one session is usually increased.

Momentum indicators also show the abrupt change in attitude. The RSI has risen above 80 and is now in highly overbought territory. This shows remarkable buying power, but it also increases the likelihood of short-term profit-taking following such a bold move. Before attempting another leg higher, SHIB has historically experienced brief consolidations after comparable vertical rallies.
But the larger trend is still developing. The long-term 200-day EMA is still sloping downward despite SHIB regaining significant moving averages, indicating that the macro bearish structure has not yet been completely refuted.
Instead of giving up the recovered averages right away, bulls will need to create support above them. The recent breakout may develop into a long-term trend reversal if buyers are able to stay above the 50-day and 100-day moving averages during the upcoming sessions.
Bitcoin recovery stabilizes
After making a significant comeback from June's sell-off, Bitcoin is still trading inside a recovery structure, but the market hasn't yet recovered enough strength to oppose the prevailing long-term downtrend. BTC has stabilized above its short-term moving averages at about $64,300, but there is still much stronger resistance above.
While Bitcoin is still trading below the 100-day and 200-day moving averages, the 50-day moving average has flattened and now offers immediate dynamic support below price. These longer-term averages define the main bearish structure that has persisted for months and are currently grouped around the $67,500-$74,000 area. They also continue to slope downward.
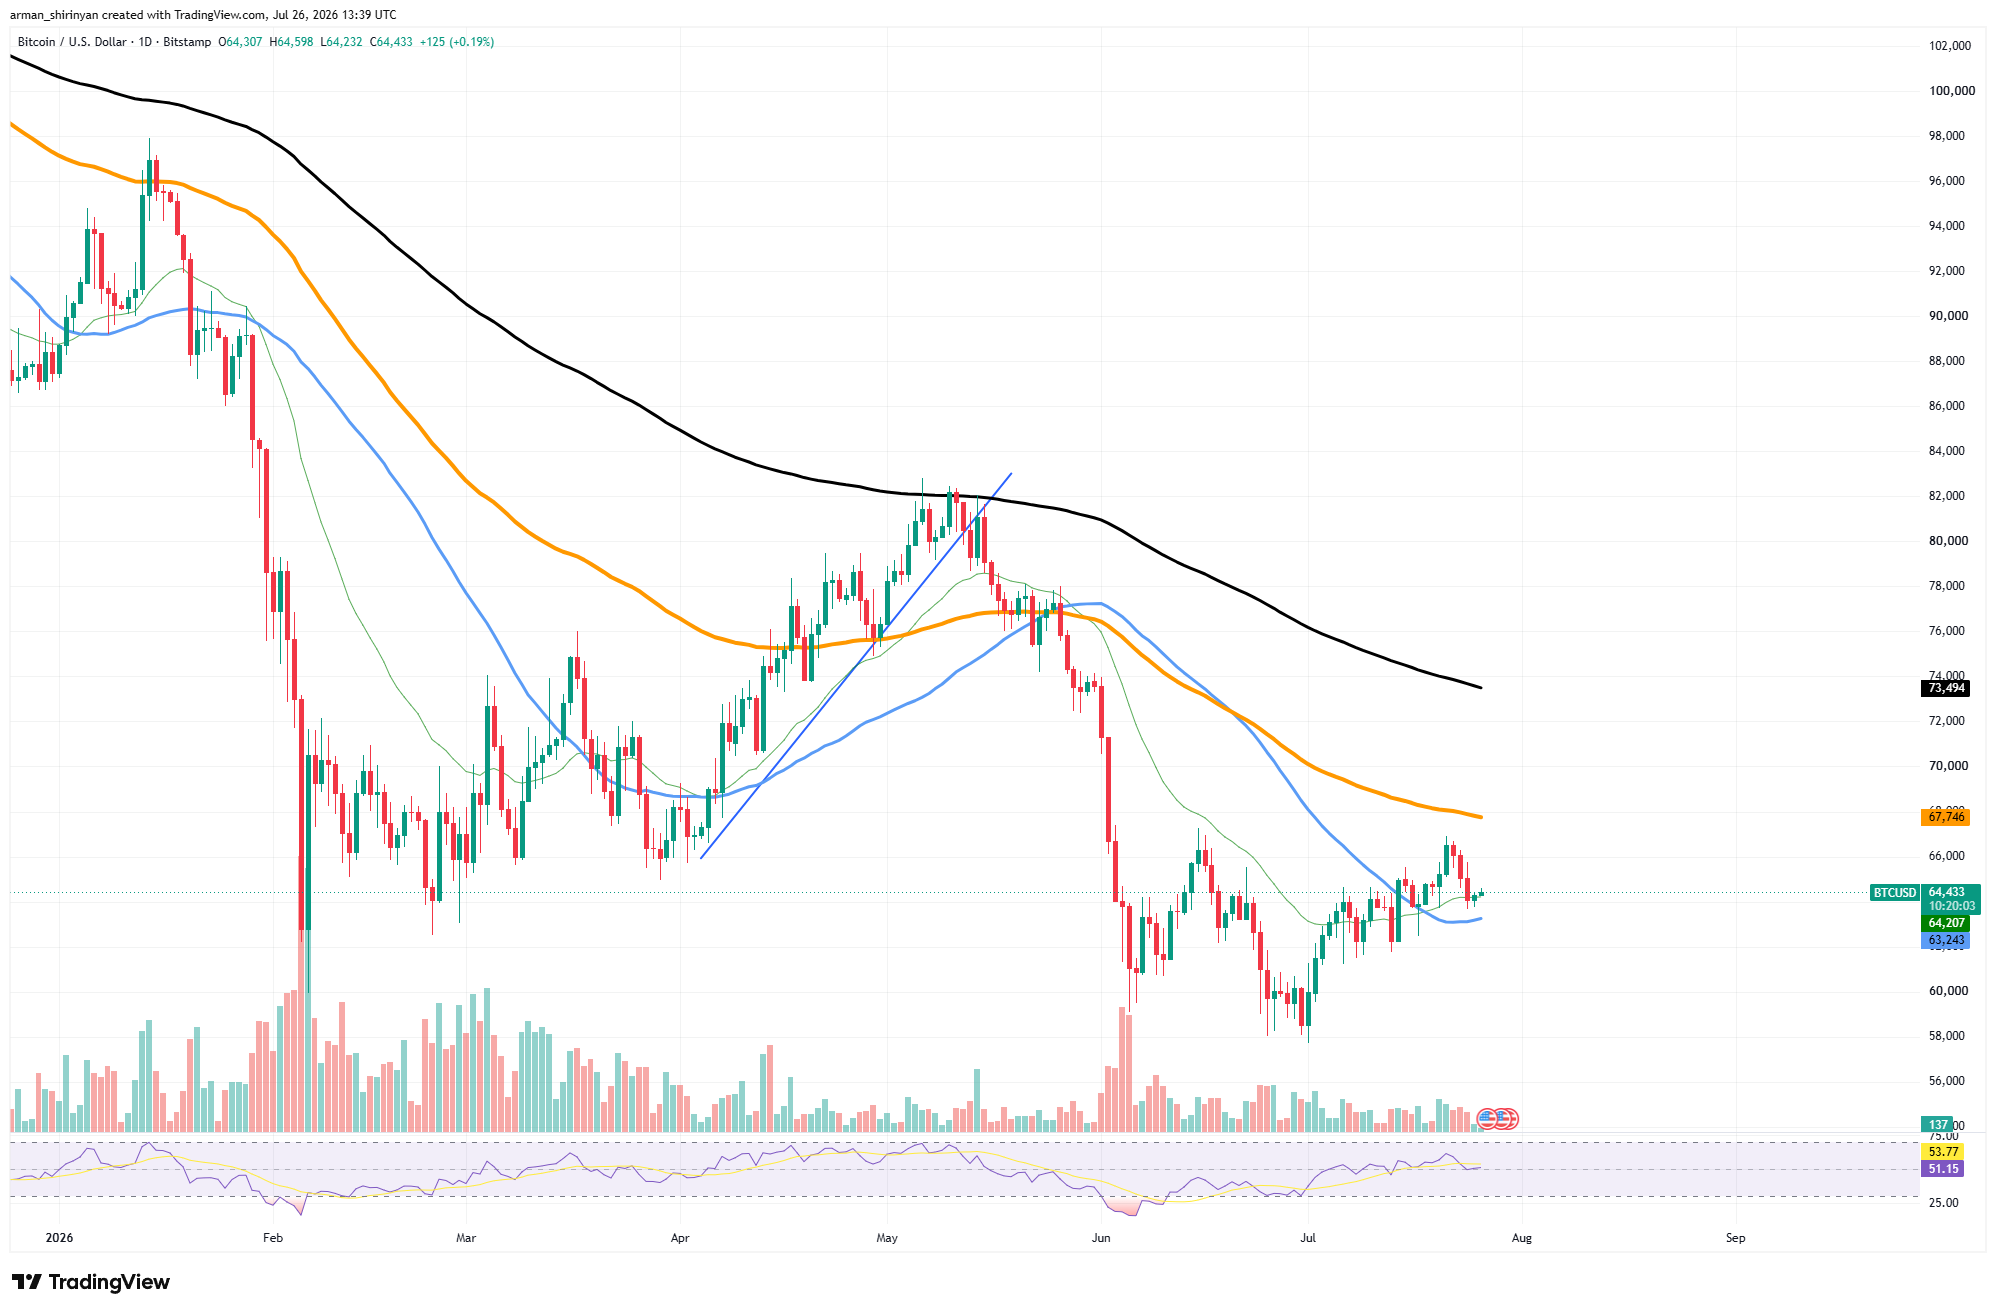
Positive indications of stabilization rather than acceleration can be seen in recent price action. Buyers successfully defended higher lows throughout July after the June capitulation, enabling Bitcoin to progressively recover without experiencing excessive volatility. Although there is still insufficient evidence, this slower recovery frequently indicates healthier accumulation as opposed to quick speculative spikes.

After hitting oversold territory during June's decline, the RSI has now recovered into the mid-50s. As a result, momentum slightly favors buyers, but it is still far below overbought levels. If market sentiment continues to improve, there is potential for another push higher. Following the massive liquidation event that occurred during the June sell-off, volume has returned to normal.
The idea that Bitcoin is building a base rather than entering a decisive trend is reinforced by the fact that neither buyers nor sellers currently control the majority of trading activity. Before Bitcoin can challenge higher resistance levels, a significant increase in volume is probably going to be necessary.
Technically speaking, recovering the 100-day moving average around $67,700 would greatly bolster the bullish argument and make it possible to test the declining 200-day EMA at $73,500. On the other hand, if the 50-day moving average is not maintained, focus will return to the $62,000–63,000 support range, which has prevented recent declines.
All things considered, Bitcoin seems to be moving from a corrective phase into an accumulation range. Although the immediate structure is better than it was in June, bulls still need to recover a number of significant moving averages before the overall technical picture becomes convincingly positive.
 U.Today Editorial Team
 Dan Burgin
