

Disclaimer: The opinions expressed by our writers are their own and do not represent the views of U.Today. The financial and market information provided on U.Today is intended for informational purposes only. U.Today is not liable for any financial losses incurred while trading cryptocurrencies. Conduct your own research by contacting financial experts before making any investment decisions. We believe that all content is accurate as of the date of publication, but certain offers mentioned may no longer be available.

As persistent institutional selling continues to negatively impact market sentiment, Hyperliquid's native token HYPE has prolonged its correction, losing about 24% over the last month.
Institutional investors are ready
Repeatedly large transfers from major investment firms to centralized exchanges have been another challenge for HYPE, while the larger cryptocurrency market has struggled to establish a clear trend. According to the most recent on-chain data, Multicoin Capital deposited an additional 137,100 HYPE, or roughly $7.51 million, into Coinbase Prime during the previous ten hours.
Bitwise sent Coinbase an additional 22,463 HYPE, or about $1.23 million, at almost the same time. Moving assets onto exchange infrastructure usually indicates an intention to increase liquidity or prepare for distribution, even though deposits do not always imply that tokens have been sold.
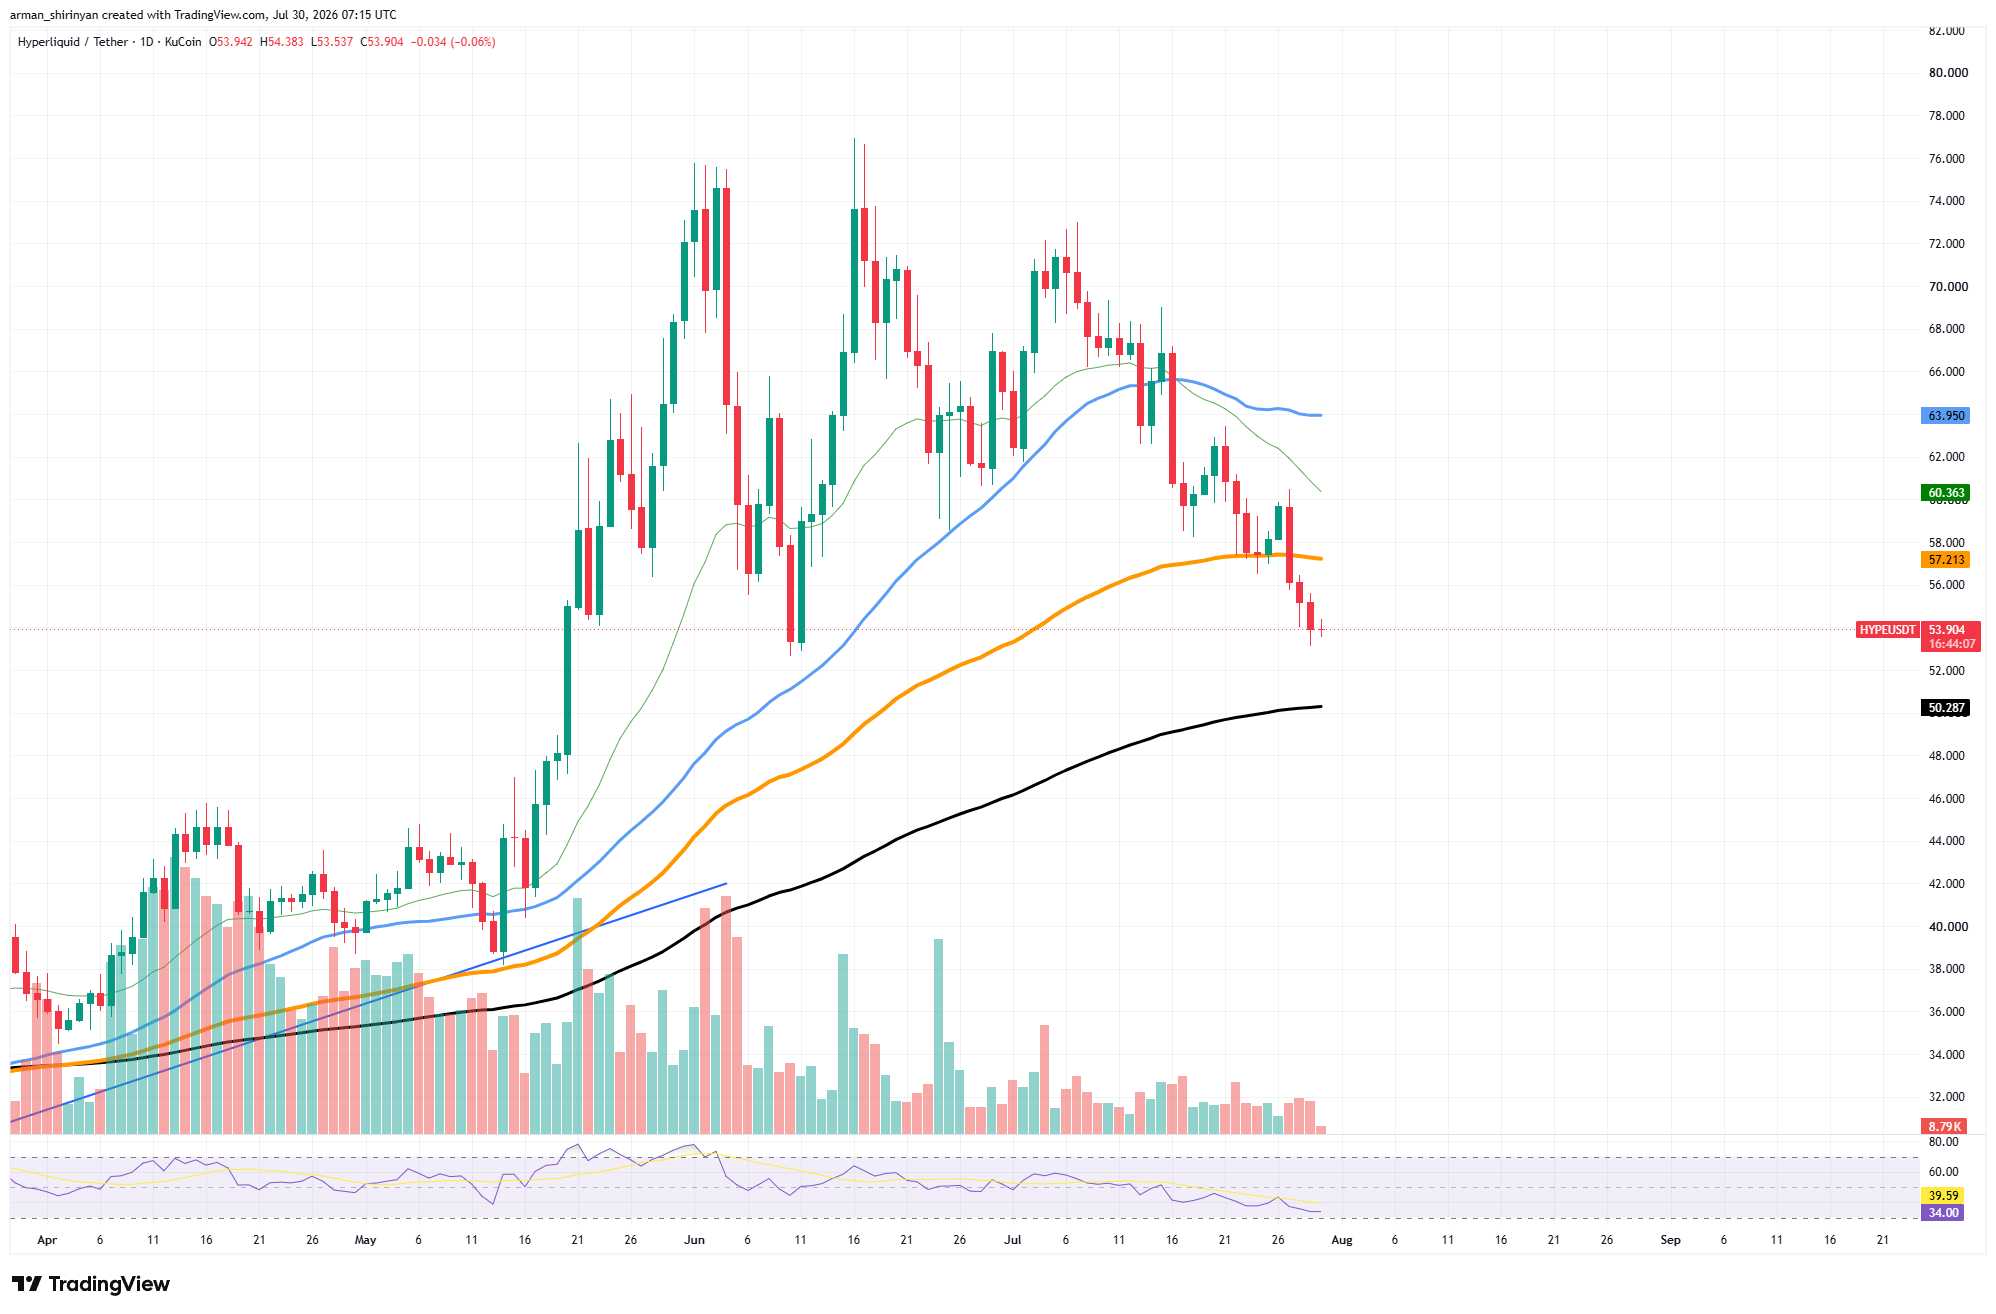
Throughout July, institutional holders have consistently decreased their exposure, and these transactions are part of a larger trend. Even in times of overall market strength, buyers find it challenging to sustain rallies due to the persistent overhead supply created by such selling. This pressure is reflected in the technical picture. After losing another significant support level around its 100-day moving average, HYPE is now trading close to $54.
The next significant long-term support is the 200-day moving average, which is located much lower near $50, while the price has also dropped below the 50-day moving average. Momentum indicators have declined significantly. For the first time in a few weeks, HYPE is approaching oversold territory as the RSI has fallen to about 34.
Bottom is closer
Oversold conditions do not always indicate the formation of a bottom, especially when large holders continue to add supply to the market, even though they can occasionally precede a relief bounce. Compared to the explosive activity observed in May and June, volume has also decreased.

In contrast to aggressive accumulation, lower trading activity and falling prices frequently signify waning buying conviction. The crucial technical zone to watch is now the range between $50 and $52. If selling pressure starts to ease, the rising 200-day moving average may attract longer-term buyers.
On the other hand, a return to the 50-day moving average around $57 would be the first sign that bulls are taking back control. As of right now, HYPE's correction appears to be driven by both ongoing institutional distribution and a deteriorating technical structure. Upside attempts are likely to encounter strong resistance until the rate of exchange inflows slows or buyers absorb the extra supply.
 Dan Burgin
 U.Today Editorial Team
