Disclaimer: The opinions expressed by our writers are their own and do not represent the views of U.Today. The financial and market information provided on U.Today is intended for informational purposes only. U.Today is not liable for any financial losses incurred while trading cryptocurrencies. Conduct your own research by contacting financial experts before making any investment decisions. We believe that all content is accurate as of the date of publication, but certain offers mentioned may no longer be available.
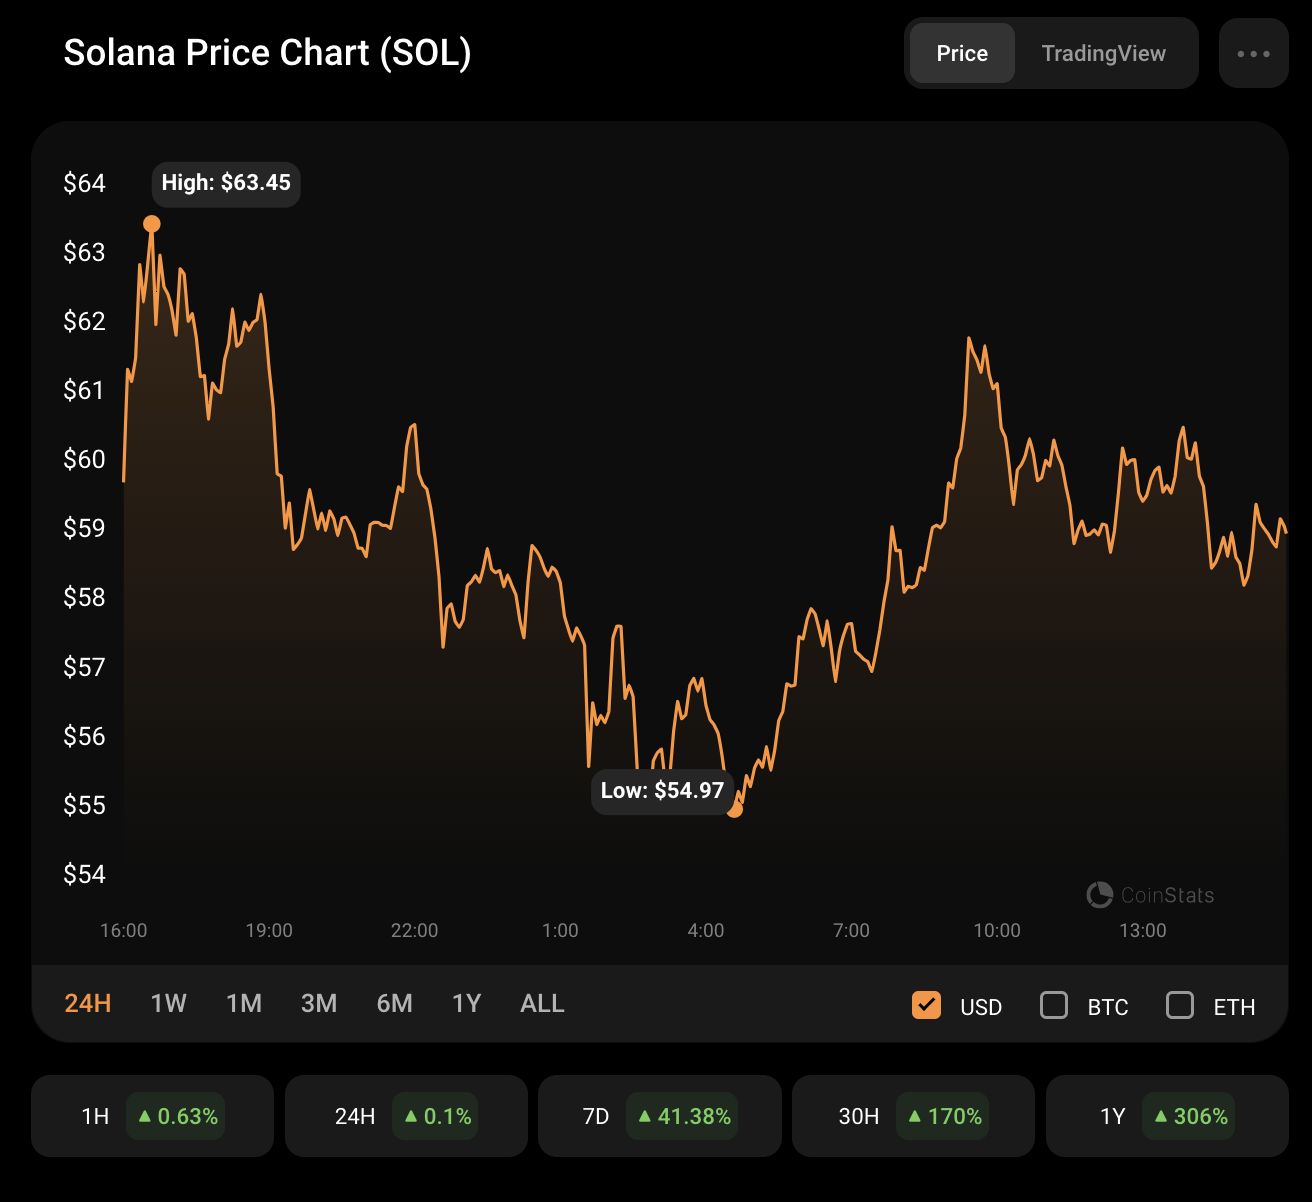
The market is facing a correction at the end of the week, according to CoinStats.
SOL/USD
Solana's (SOL) rate has rocketed by more than 40% over the last week.
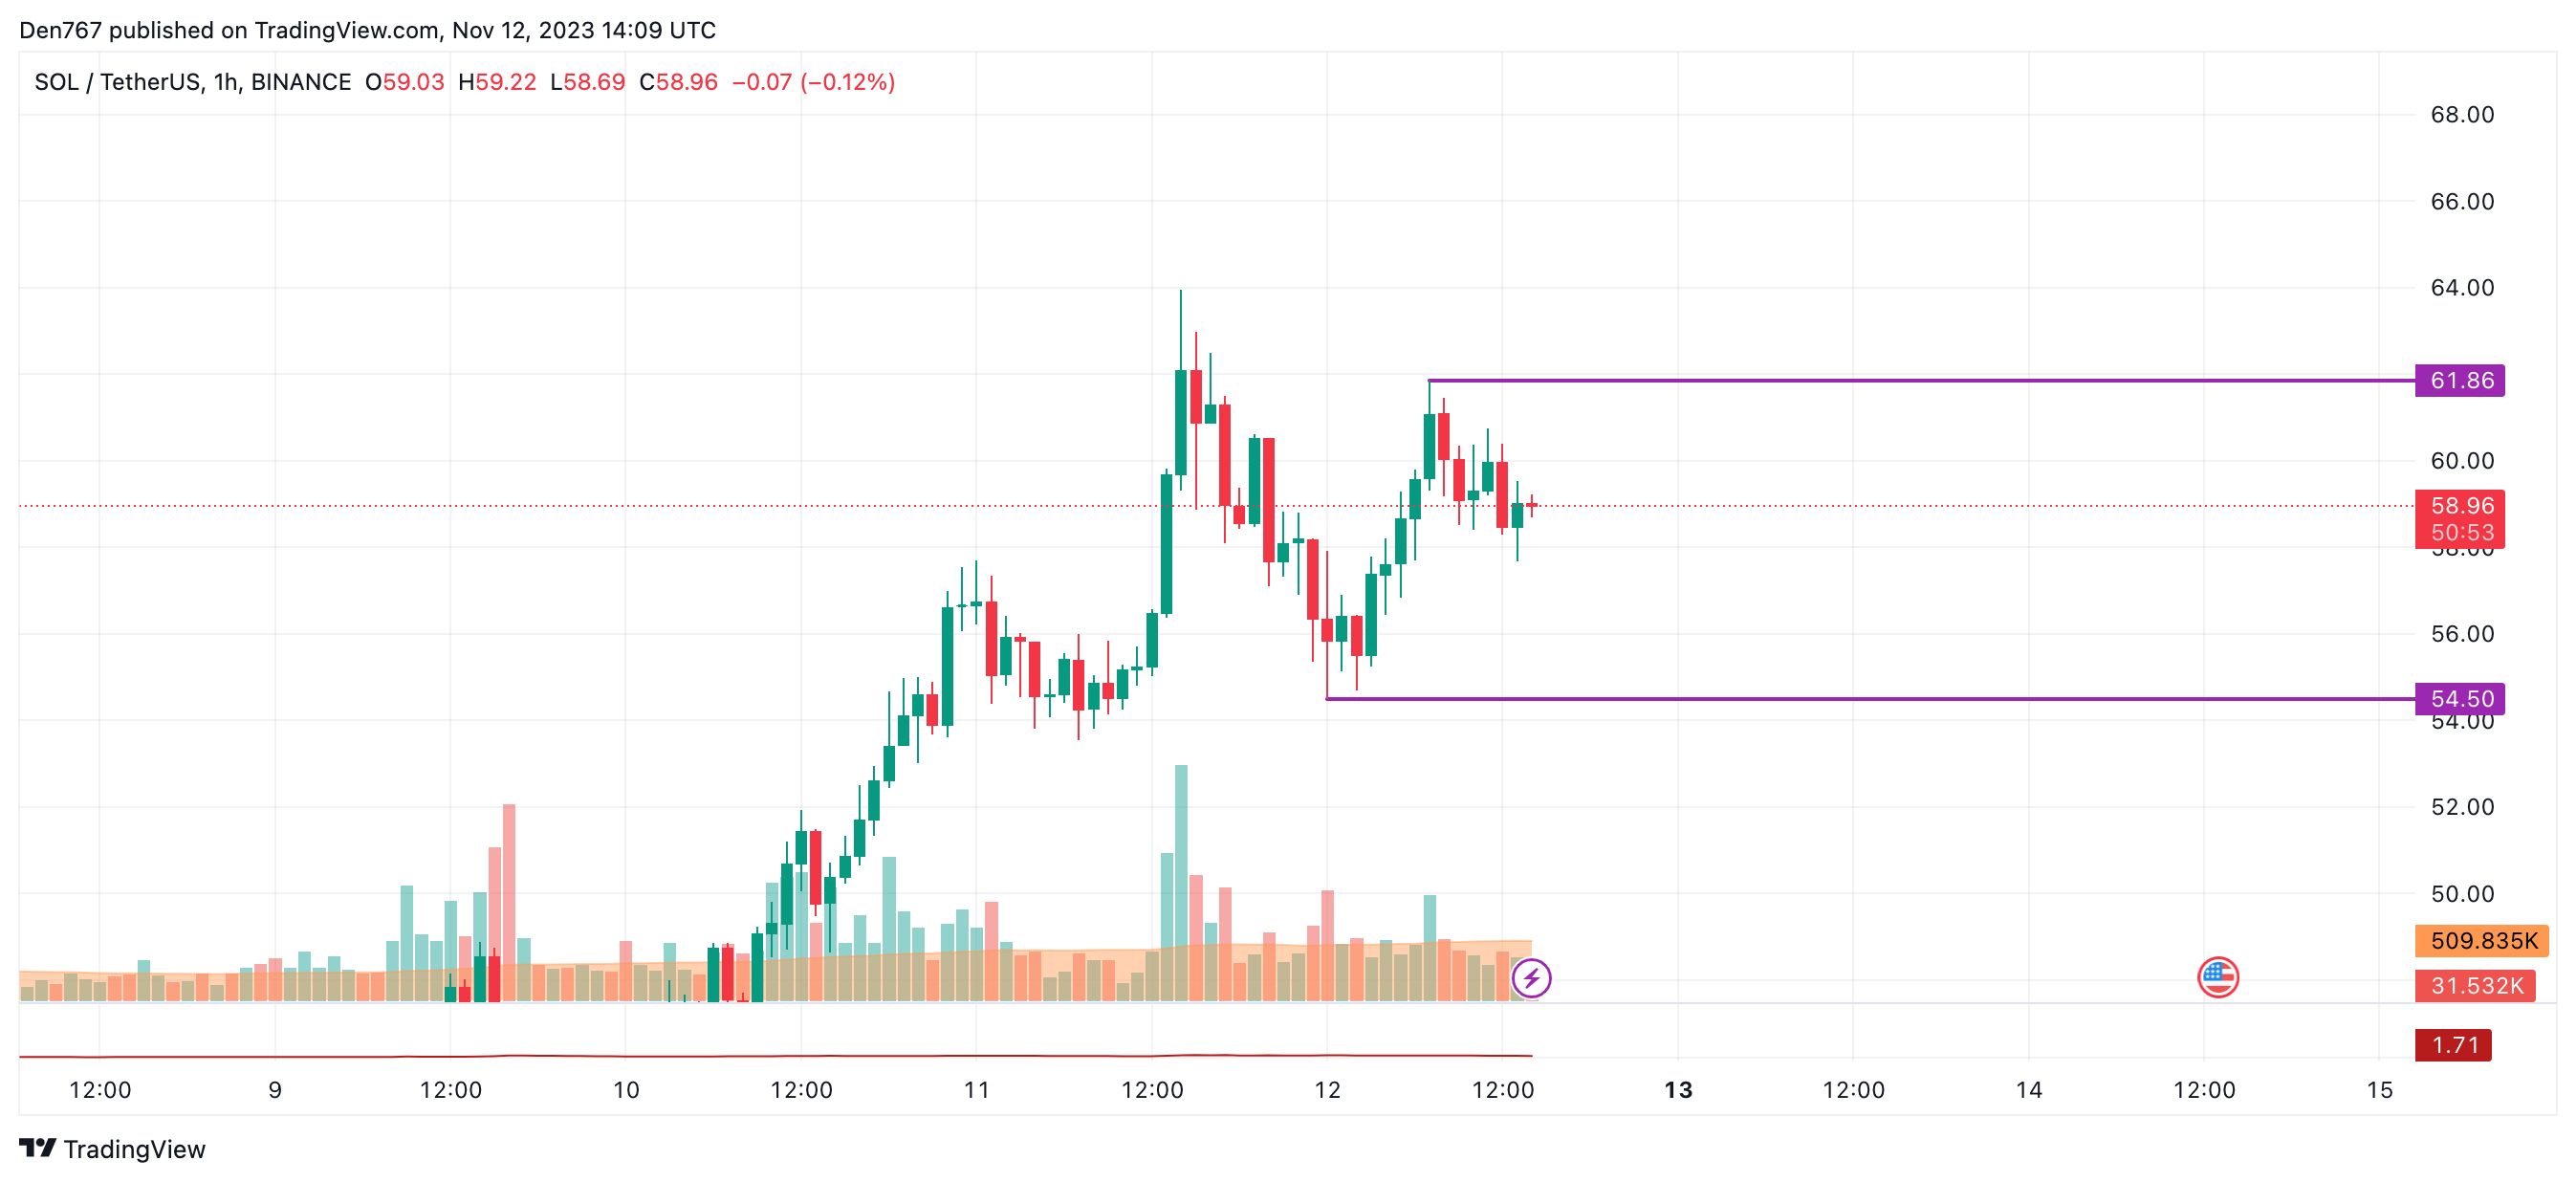
On the hourly chart, the rate of SOL is located close to the resistance, which means that buyers are more powerful than sellers to a certain extent. If the situation does not change by the end of the day, the growth may continue to $64.
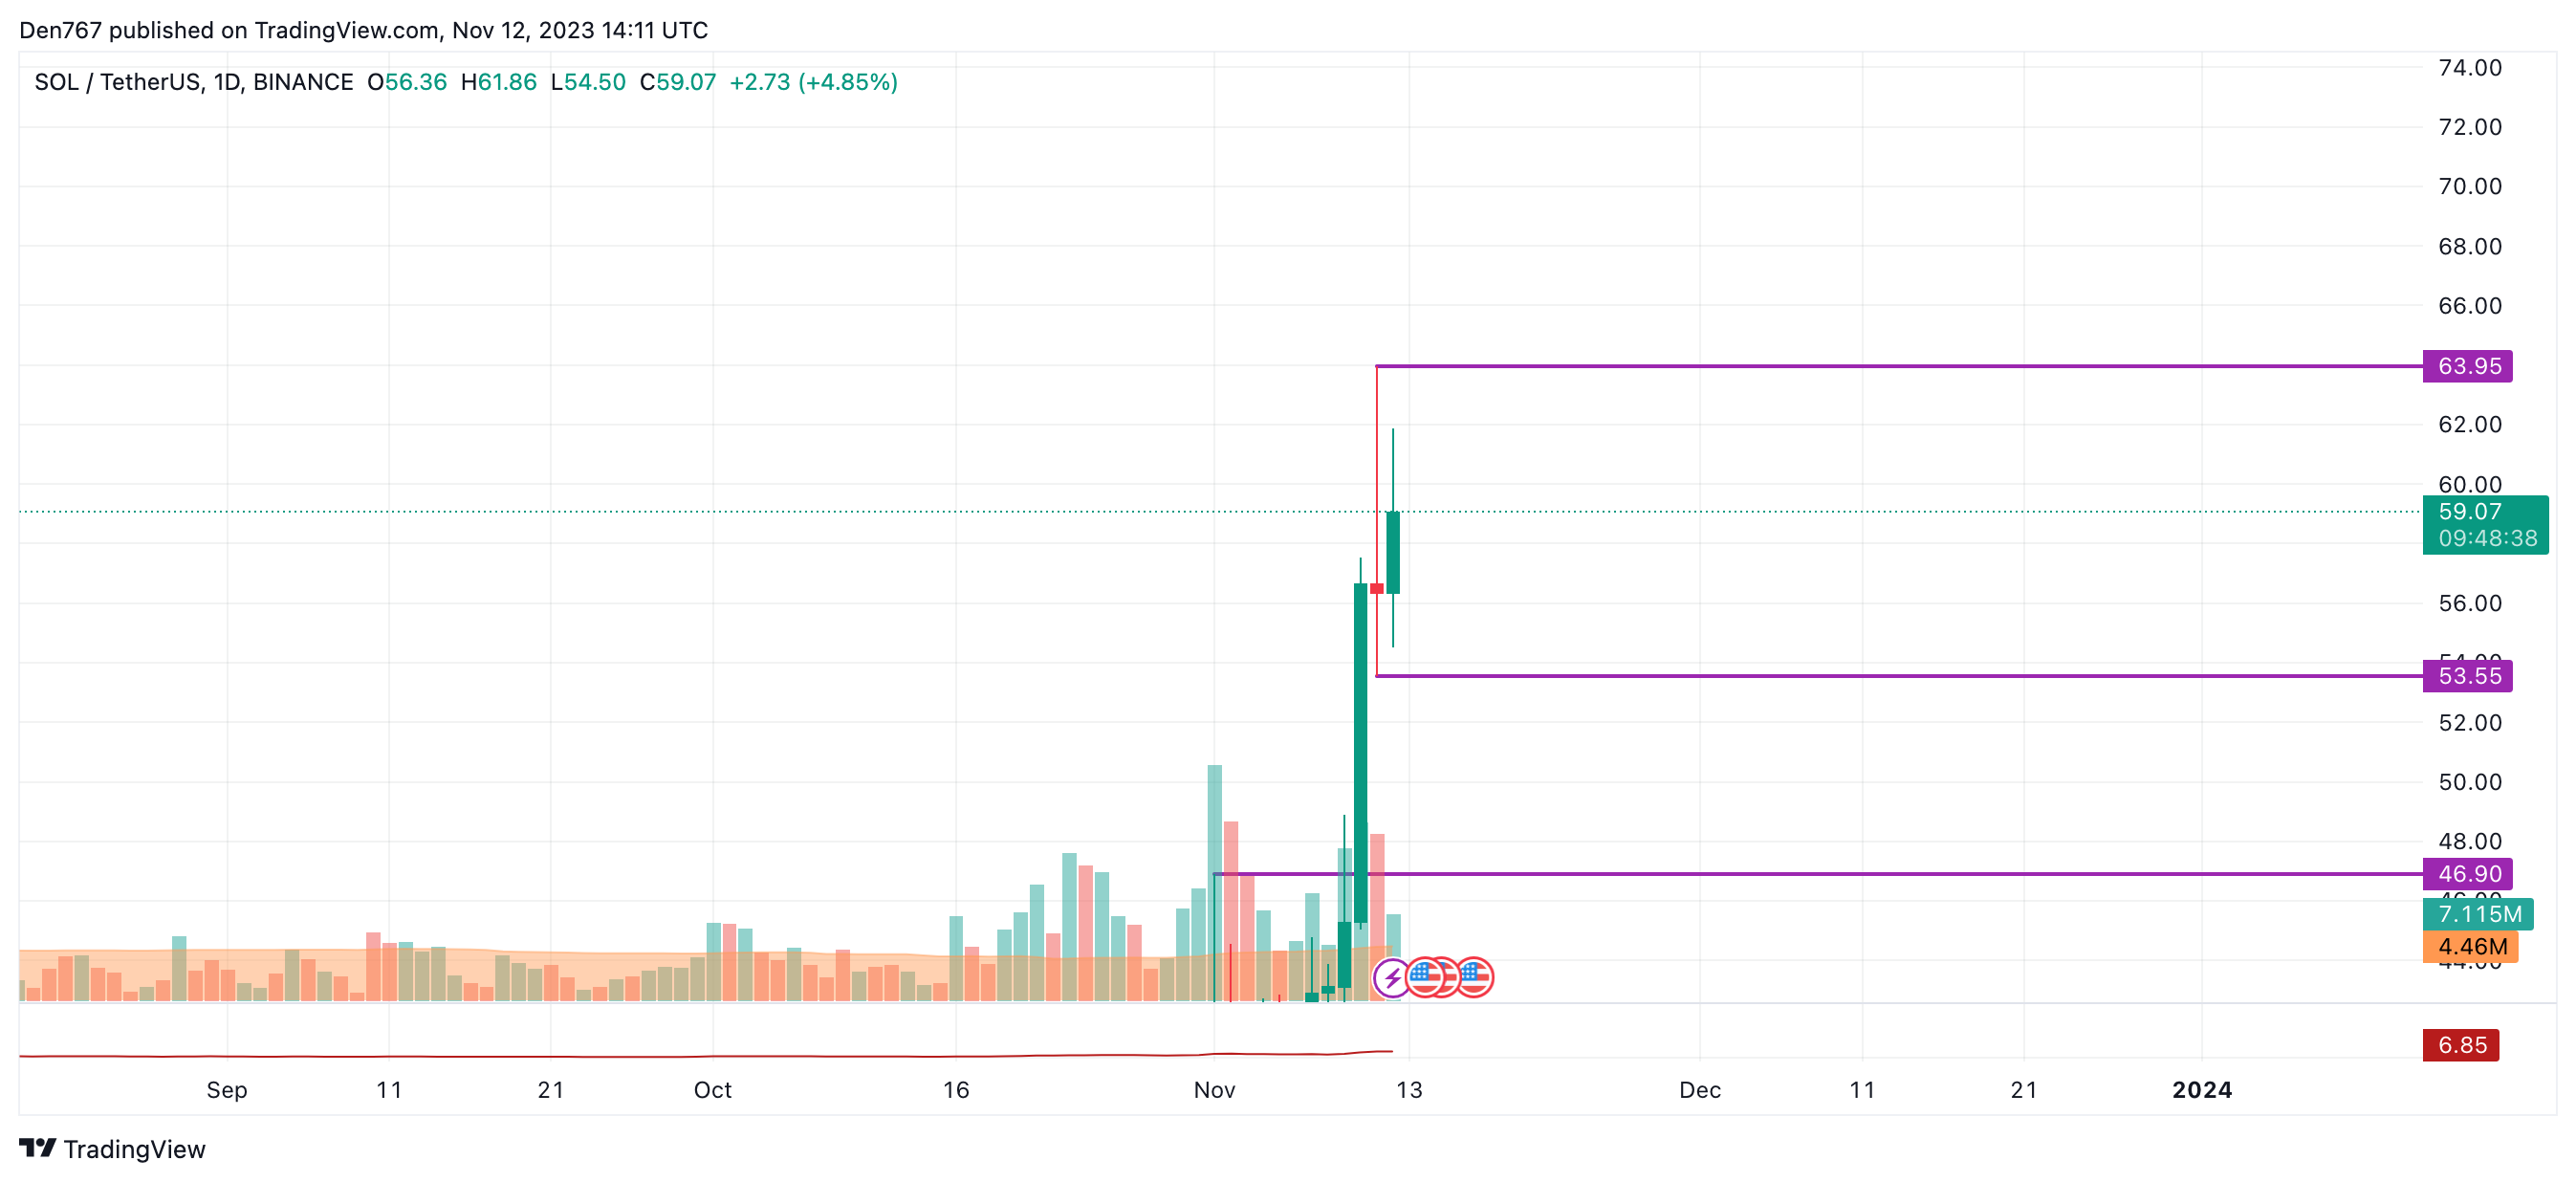
On the bigger time frame, the price is located within yesterday's candle, which means that the rate of SOL might need time to accumulate energy for a further move.
In this regard, consolidation in the range of $55-$60 is the more likely scenario for next week.
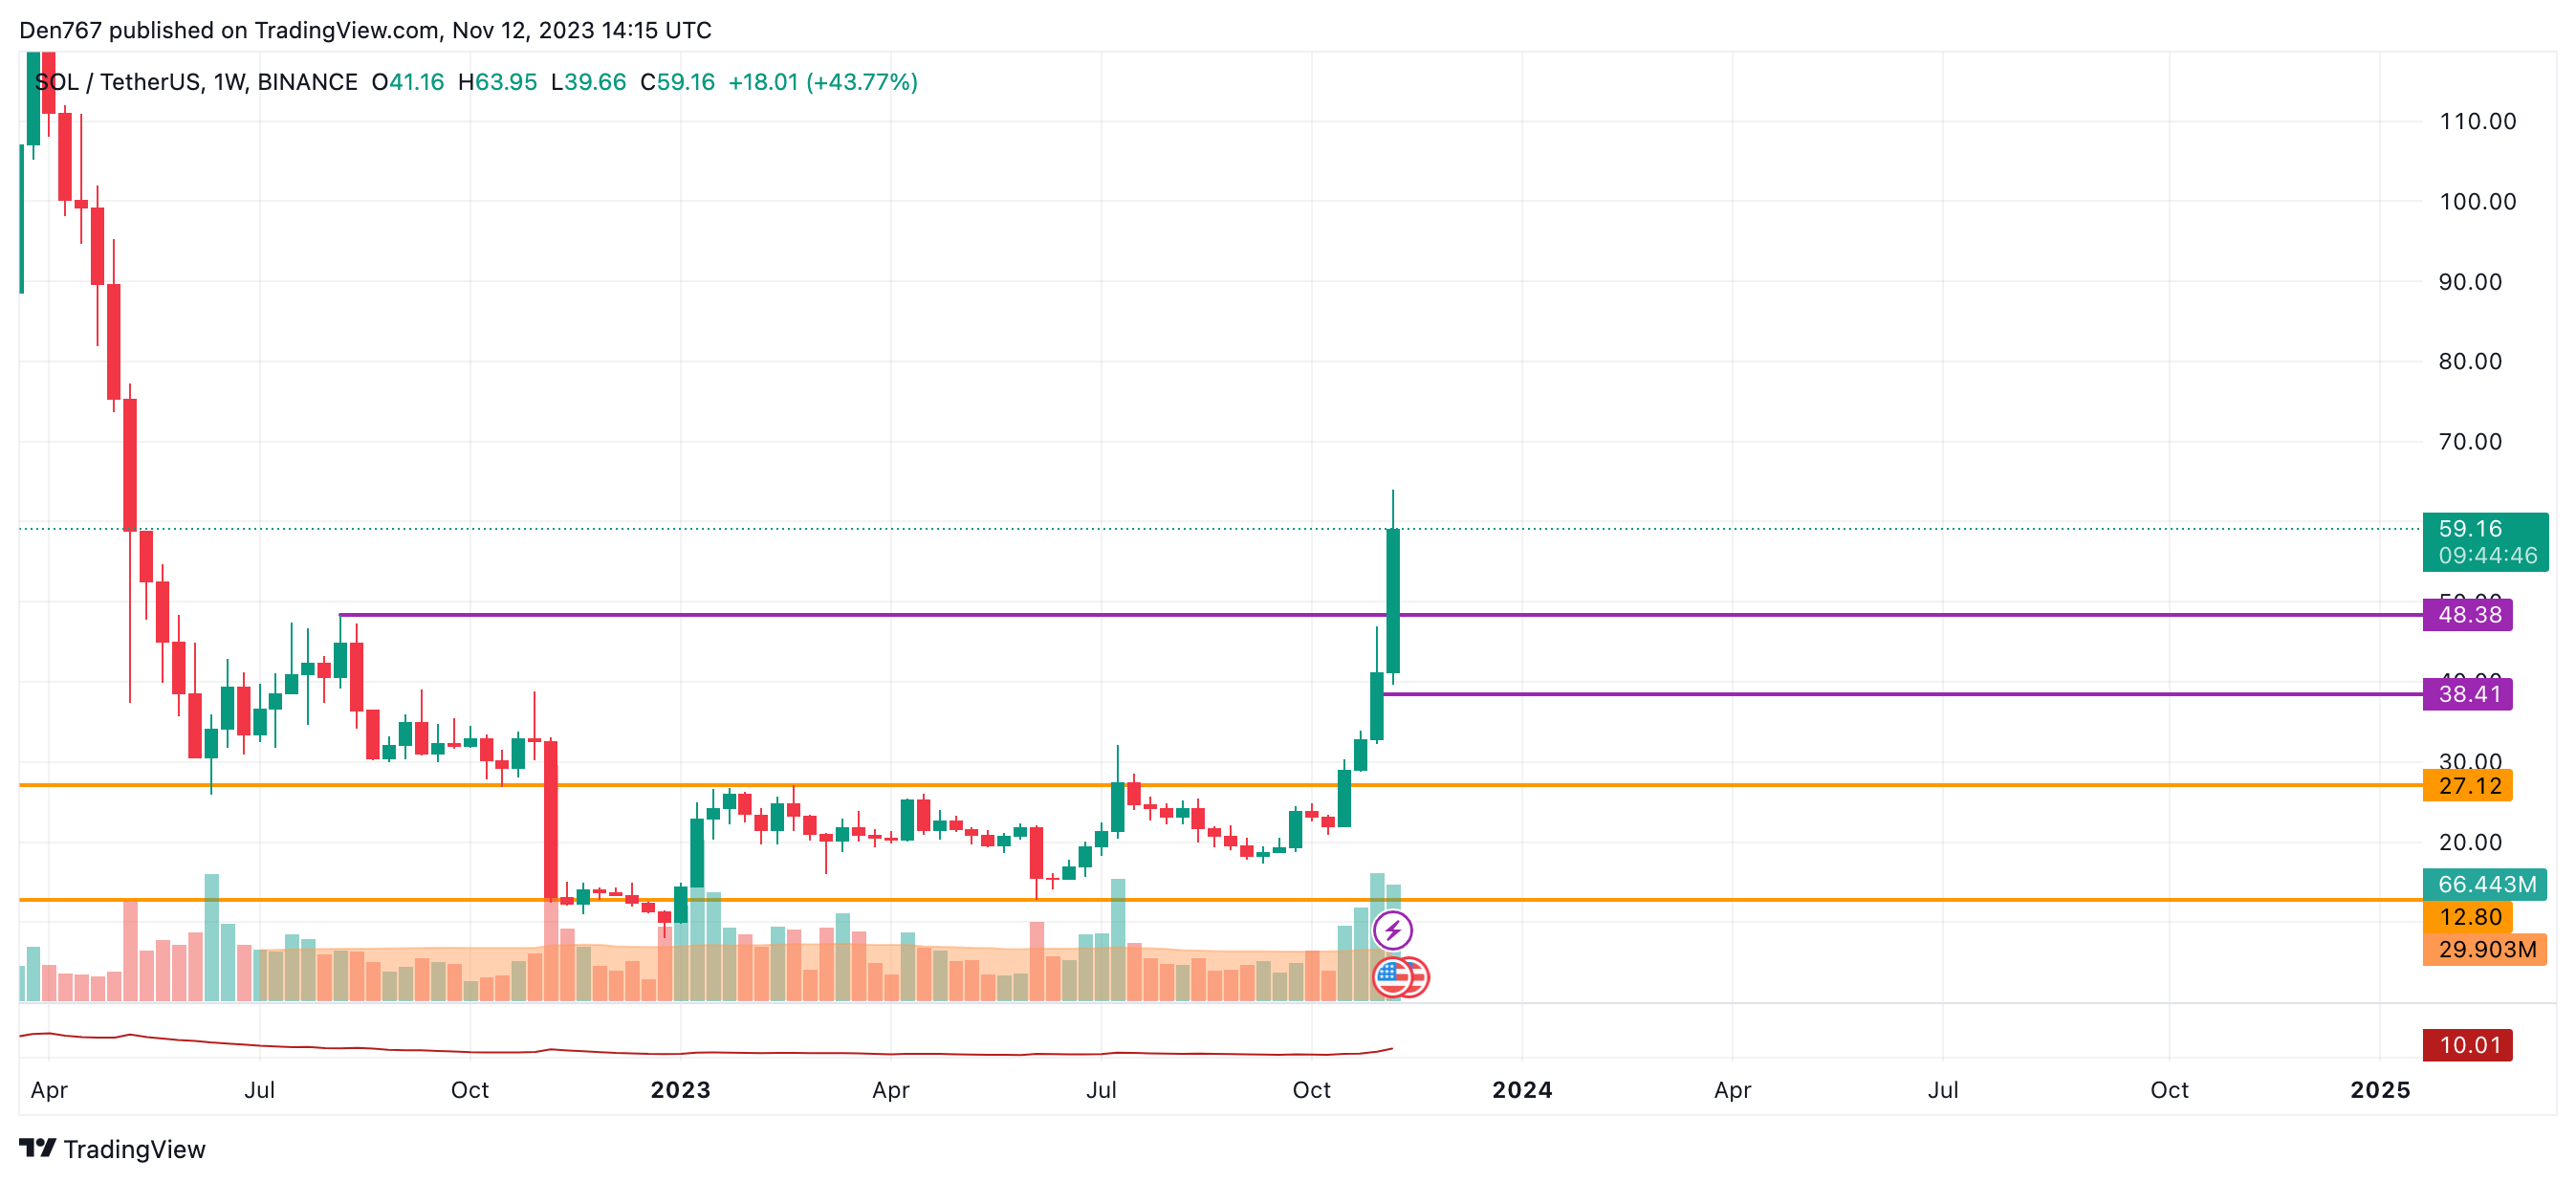
On the weekly chart, the rate of SOL is about to close in the bullish zone. At the moment, there are no bearish signals yet. If the bar closes near the $60 zone, the rise may lead to a test of the $70 zone soon.
SOL is trading at $59.16 at press time.
 Dan Burgin
 U.Today Editorial Team