
Disclaimer: The opinions expressed by our writers are their own and do not represent the views of U.Today. The financial and market information provided on U.Today is intended for informational purposes only. U.Today is not liable for any financial losses incurred while trading cryptocurrencies. Conduct your own research by contacting financial experts before making any investment decisions. We believe that all content is accurate as of the date of publication, but certain offers mentioned may no longer be available.
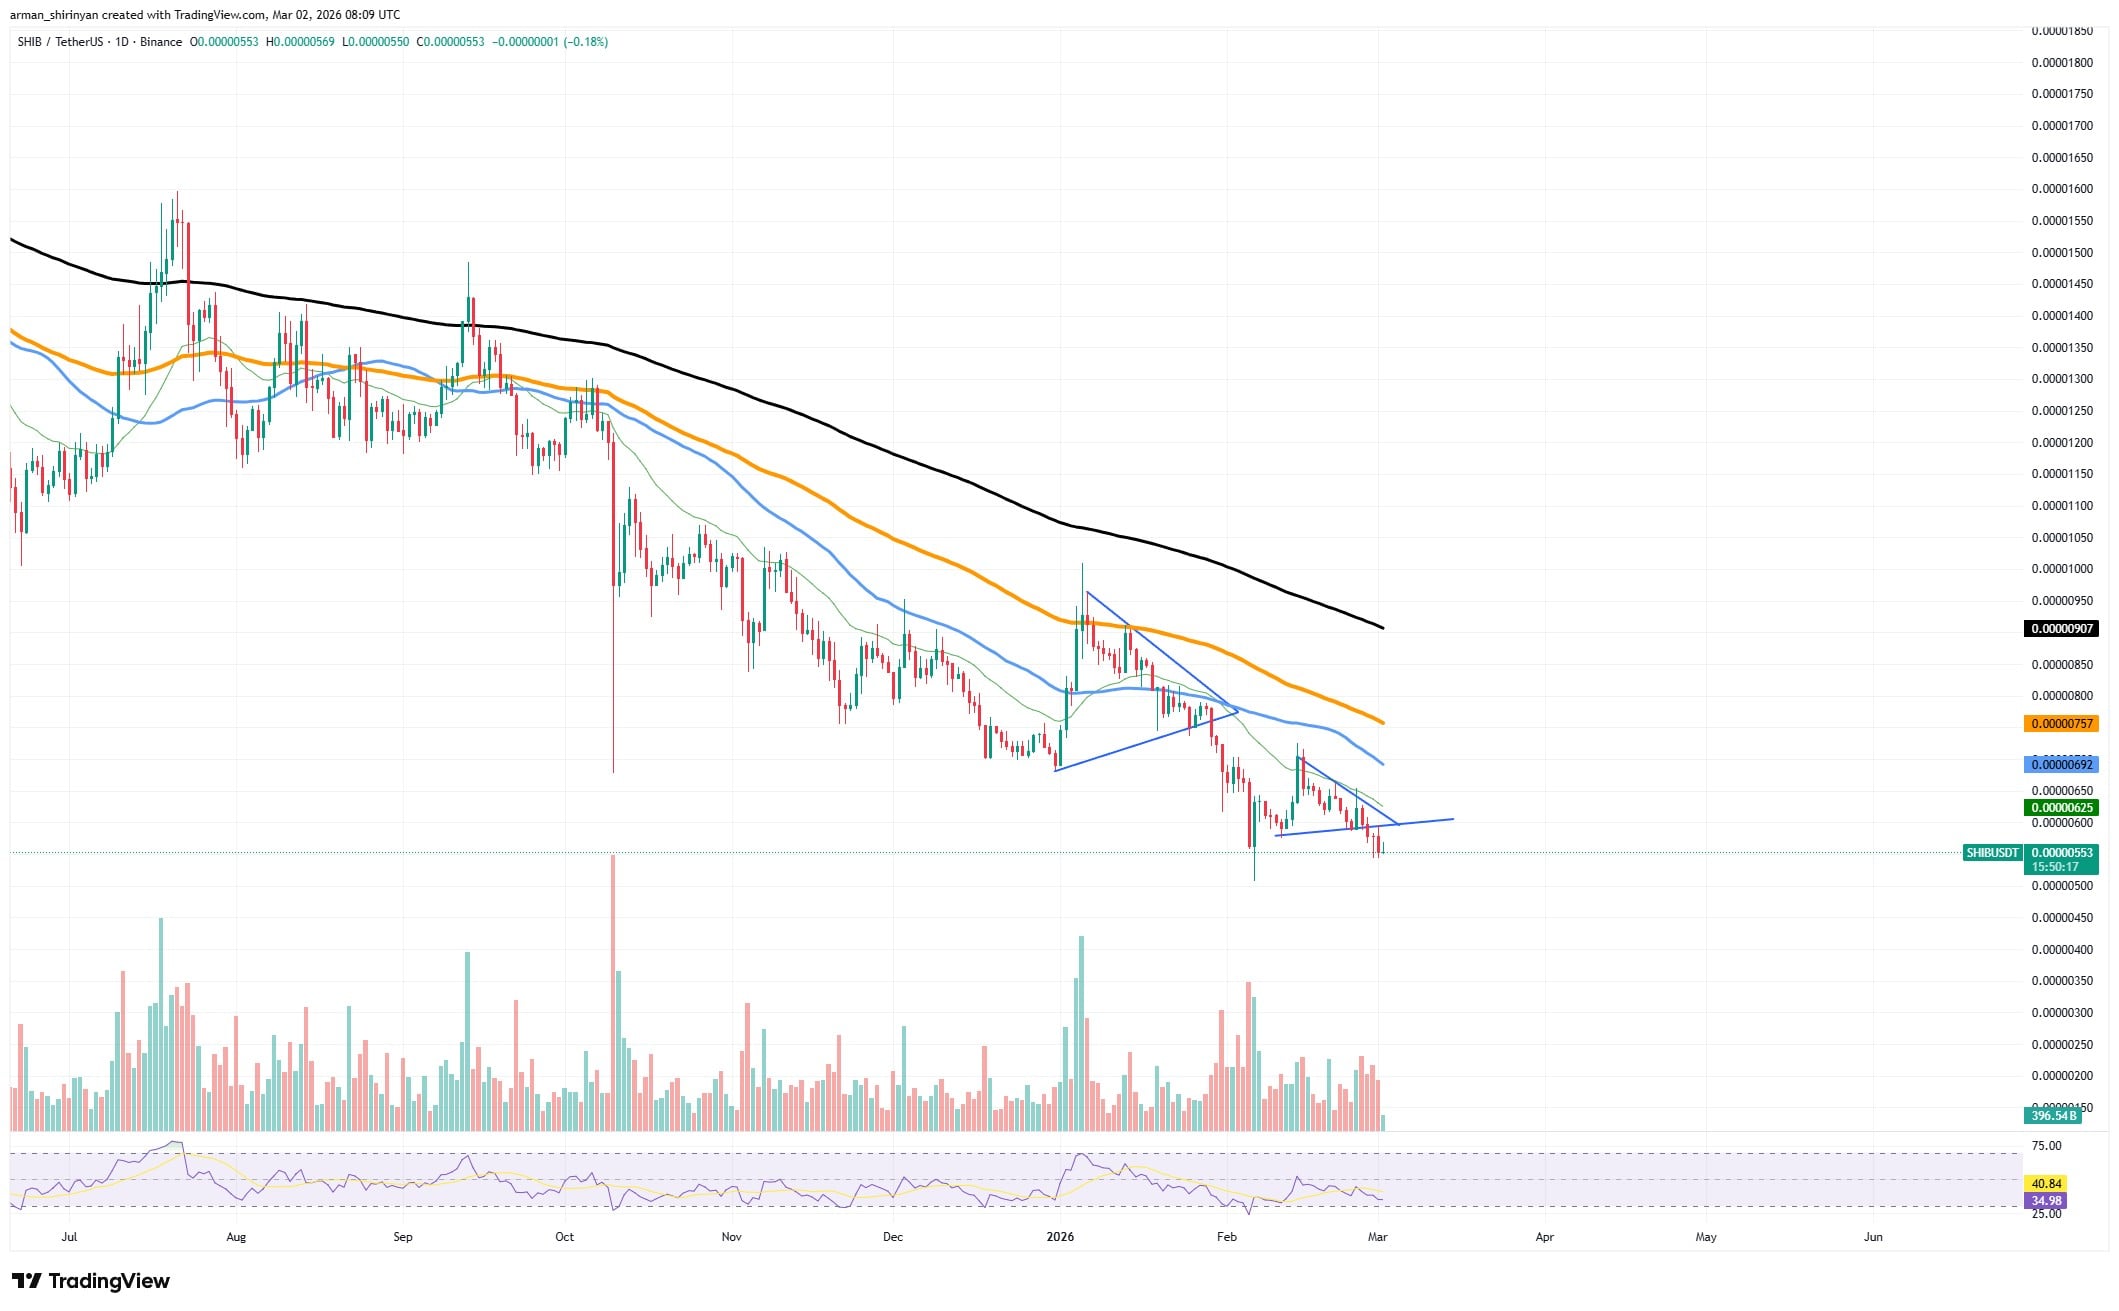
After a lengthy period of grinding downward pressure, Shiba Inu is currently sitting at what could be called a reset zone. The price is trading below all of the major moving averages, indicating a persistent downtrend with lower highs and lows. Although the trend is still bearish structurally, the current positioning also shows indications that SHIB may be nearing an exhaustion phase, where sellers start to lose steam and a relief move becomes feasible.
Shiba Inu remains lower
Momentum provides the initial oversold signal. RSI levels are in the lower range, suggesting that the price has already entered historically weak territory due to bearish pressure. Oversold readings frequently precede brief rebounds when sellers run out of fuel, but they do not by themselves indicate a reversal.
Second, despite breaking local supports, the price has consistently failed to extend aggressively. Smaller candles and less directional conviction are the results of SHIB compressing close to lows rather than a clear continuation breakdown. The market is usually looking for equilibrium following a significant drop, as indicated by this behavior.
The third metric has to do with structure. The recent consolidation suggests a possible accumulation phase by forming a tightening range with a slight upward bias from local lows. This setup indicates that the downward momentum is slowing, at least temporarily, despite its fragility.
Most likely outcome
The most likely scenario is a relief rally rather than a complete trend reversal if buyers are able to intervene. The chart structure would be best served by a move toward nearby resistance, which is roughly 15-20% from current levels, especially if short sellers start covering positions. These kinds of recoveries are typical following protracted sell-offs, but they frequently stay small unless significant resistance areas are regained.

But expectations must remain realistic. Moving averages are stacked bearishly, the overall trend is still downward and prior recovery attempts were promptly sold into. Any upward movement could therefore be short-lived unless it is backed by more positive sentiment across the board.
The most likely course from here is either a brief oversold bounce that tests overhead resistance or further sideways consolidation close to current lows.
 Dan Burgin
 Vladislav Sopov