
Disclaimer: The opinions expressed by our writers are their own and do not represent the views of U.Today. The financial and market information provided on U.Today is intended for informational purposes only. U.Today is not liable for any financial losses incurred while trading cryptocurrencies. Conduct your own research by contacting financial experts before making any investment decisions. We believe that all content is accurate as of the date of publication, but certain offers mentioned may no longer be available.
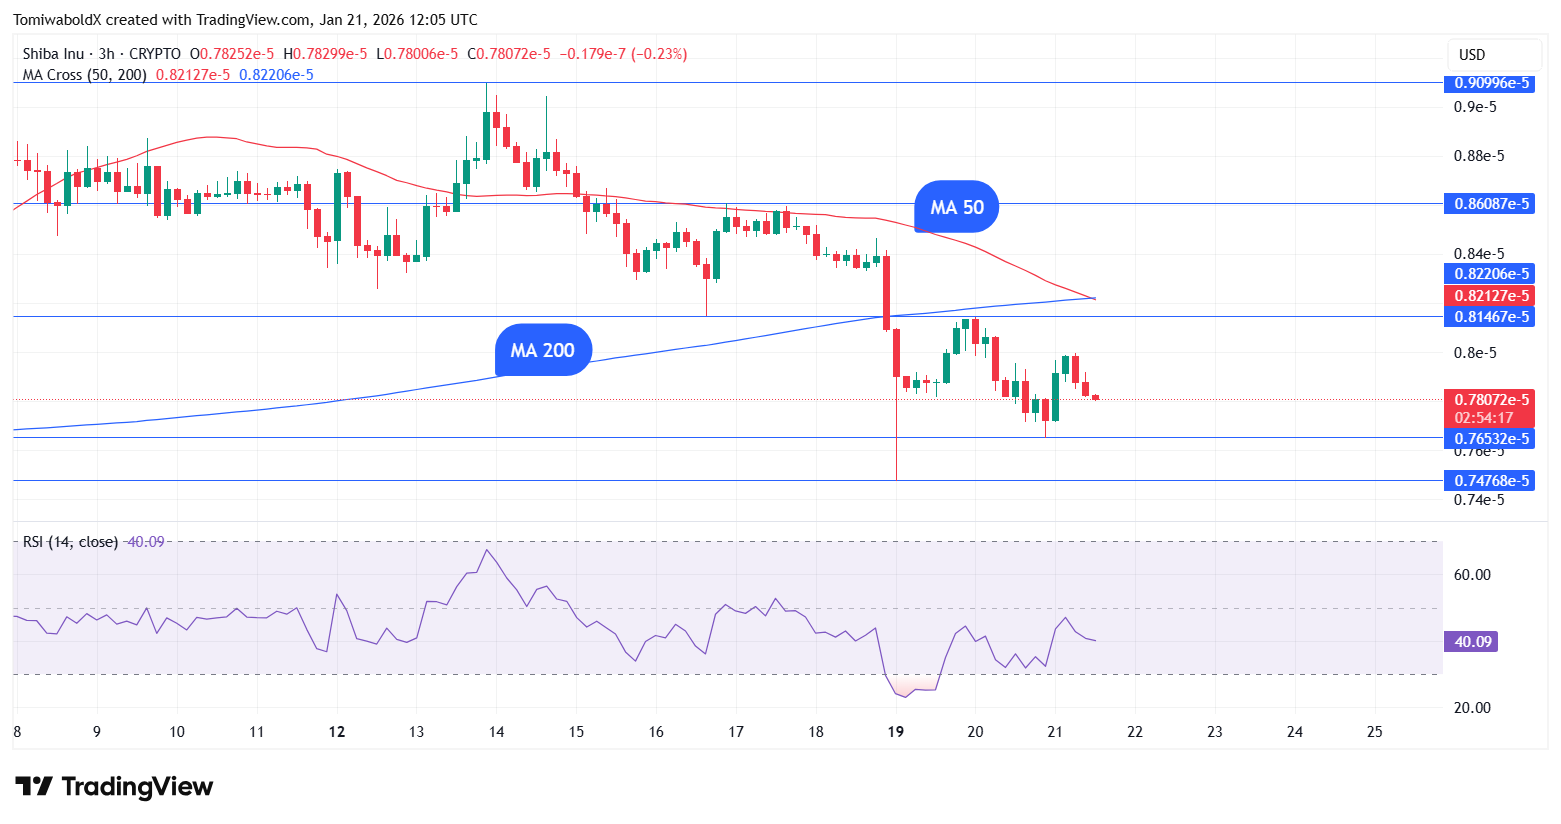
Shiba Inu is forming a death cross on its three-hour chart, the first such in 2026. The downward-facing three-hour MA 50 has converged with the MA 50 and is set to drop below it, to confirm a death cross.
The last time such a short-term signal appeared on the SHIB three-hour chart was in mid-December 2025, which saw Shiba Inu drop to $0.00000681 in the weeks that followed.
Shiba Inu began the year 2026 with optimism surrounding its price action. SHIB sharply rose in the first few days of 2026, reaching a high of $0.00001017 on Jan. 5.
A golden cross on the three-hour chart preceded Shiba Inu's surge to a high of $0.00001017 on Jan. 5, with the signal appearing about 24 hours before the rise.
This might suggest that golden or death crosses on the Shiba Inu three-hour chart have mostly foreshadowed its short-term price action, especially in recent times.
With the first 2026 death cross on the three-hour chart set to complete a few sessions ahead, potential scenarios are presented, given the current market sell-off.
Potential scenarios
At press time, SHIB was up 0.09% in the last 24 hours to $0.00000782 but down 10.02% weekly.
Shiba Inu indicated a Dragonfly Doji on its daily chart on Monday. A Dragonfly Doji is a candlestick pattern that could indicate a potential price reversal to the downside or upside, depending on previous price movement.
The extended lower shadow indicates strong selling during Monday's trading session, in line with the broader crypto market drop, but buyers were able to absorb the selling and push the price back up to close the day in green.
A confirmation of this candle pattern is yet to be obtained and will be awaited in the coming session. If Shiba Inu sustains its current rebound, it will aim for the daily MA 50 at $0.000008 next.
On the other hand, the possibility of sideways trading exists, as Shiba Inu returned to the lower end of its trading range. Support is expected at $0.00000688 in case the price declines further.
 Dan Burgin
 U.Today Editorial Team