
This weekend has been an emotional rollercoaster for Bitcoin traders. The digital asset jumped to test the $4200 mark only to drop minutes later into the $3800 area. The move is considered market manipulation by many traders but there is little evidence to who is responsible. Despite this, the cryptocurrency market is holding steady near $130 billion despite most of the top coins posting losses.
Ripple (XRP) Price Prediction
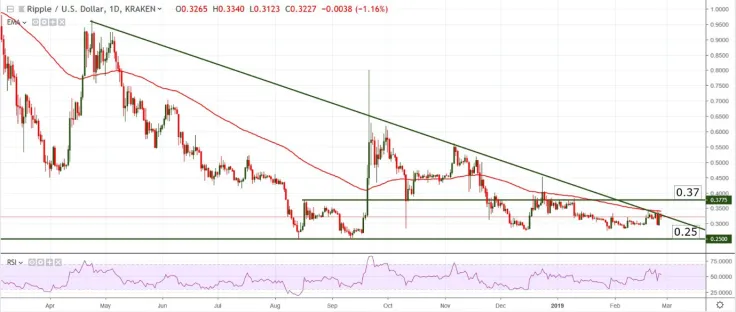
Coinbase just announced that Ripple’s XRP will be listed on their exchange. The announcement spurred a recovery from $0.29 territory to $0.32 where it’s currently trading. The circulating supply is valued at $13,232,810,309 which puts XRP in third place overall in terms of market cap. XRP is currently dealing with a long-term bearish trend line and has recently tested $0.35 resistance but failed to break the level.
If we see a break of said trend line it will almost certainly encourage more buyers to join in the rally. If more traders join in that will facilitate a break of the 50 days EMA and possibly a move into the $0.37. If not, well if not we can expect to see a retest of support.
Binance Coin (BNB) Price Prediction
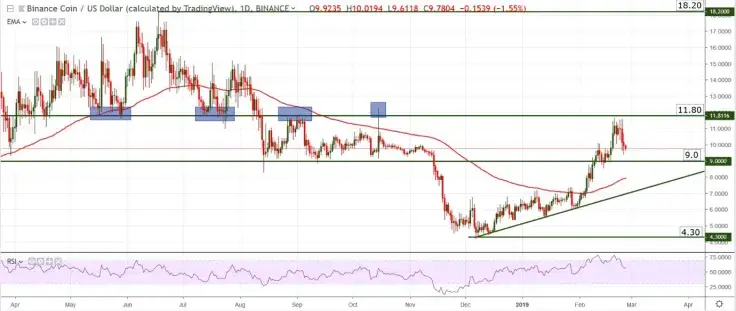
Following the testnet launch of Binance DEX BNB climbed to test resistance at $11.80. The move was met by sellers leaving the token trading near $9.64 in what seems to be a normal retracement, not a reversal. Binance Coin is still in an uptrend and as long as it holds above $8.50 - $9.00 we should expect to see additional moves higher.
This week we may not see price approach $9.00 where a bounce is highly probable. Because the Relative Strength Index was overbought the move lower is technically sound and healthy for the development of the longer-term uptrend.
IOTA (MIOTA) Price Prediction
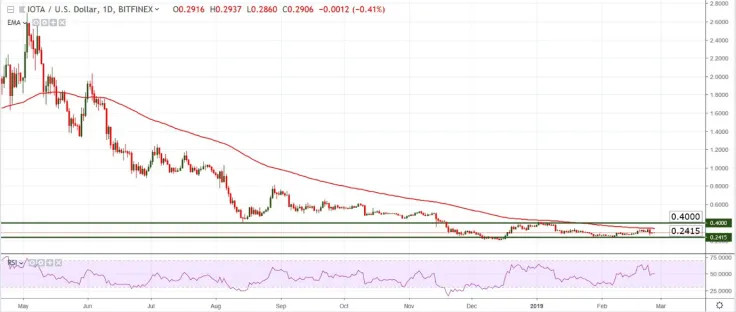
With a total circulating supply valued at $793,405,425, MIOTA is currently trading at 0.28 against the US Dollar and is ranked number 14 according to CoinMarketCap. The digital asset has been trading in a range between $0.20 and $0.40 with immediate support at $0.2415.
It is below the 50 days EMA and the latest move was a drop from $0.33 vicinity into $0.26 so downward pressure is still present. Some of the losses were erased but there is not much bullish pressure and volatility is low, so I don’t expect the pair to move outside its range over the next week.
Dash (DASH) Price Prediction
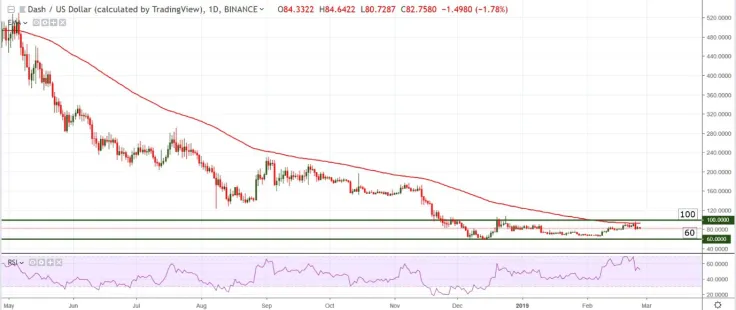
Standing just behind IOTA at number 15 in CoinMarketCap rankings. Dash has a total circulating supply value of $714,429,658 and is trading near 83 against the US Dollar. It has lost 6.21% in the last 7 days but regained a small 0.52% over the last 24 hours. DASH/USD is contained inside the range created by $60 and $100 levels but recently confirmed the upper boundary of the channel.
The 50 days EMA and the horizontal level at $100 are forming a confluence zone (a place where two or more technical elements are close together) that will be difficult to break. If there is a break of the said zone it will show increased bullish pressure that may lead the token higher. I don’t expect DASH to break the horizontal channel this week but a re-test of $100 is not out of the question.
 Dan Burgin
 U.Today Editorial Team