

Disclaimer: The opinions expressed by our writers are their own and do not represent the views of U.Today. The financial and market information provided on U.Today is intended for informational purposes only. U.Today is not liable for any financial losses incurred while trading cryptocurrencies. Conduct your own research by contacting financial experts before making any investment decisions. We believe that all content is accurate as of the date of publication, but certain offers mentioned may no longer be available.

After an aggressive August breakout, Bitcoin is consolidating, but because it is still well above the 200-day moving average, the daily structure remains heavily biased in favor of buyers. After peaking just above $81,000, Bitcoin is currently trading at about $78,840. The move started at about $63,000, so Bitcoin gained almost 30% before facing significant resistance.
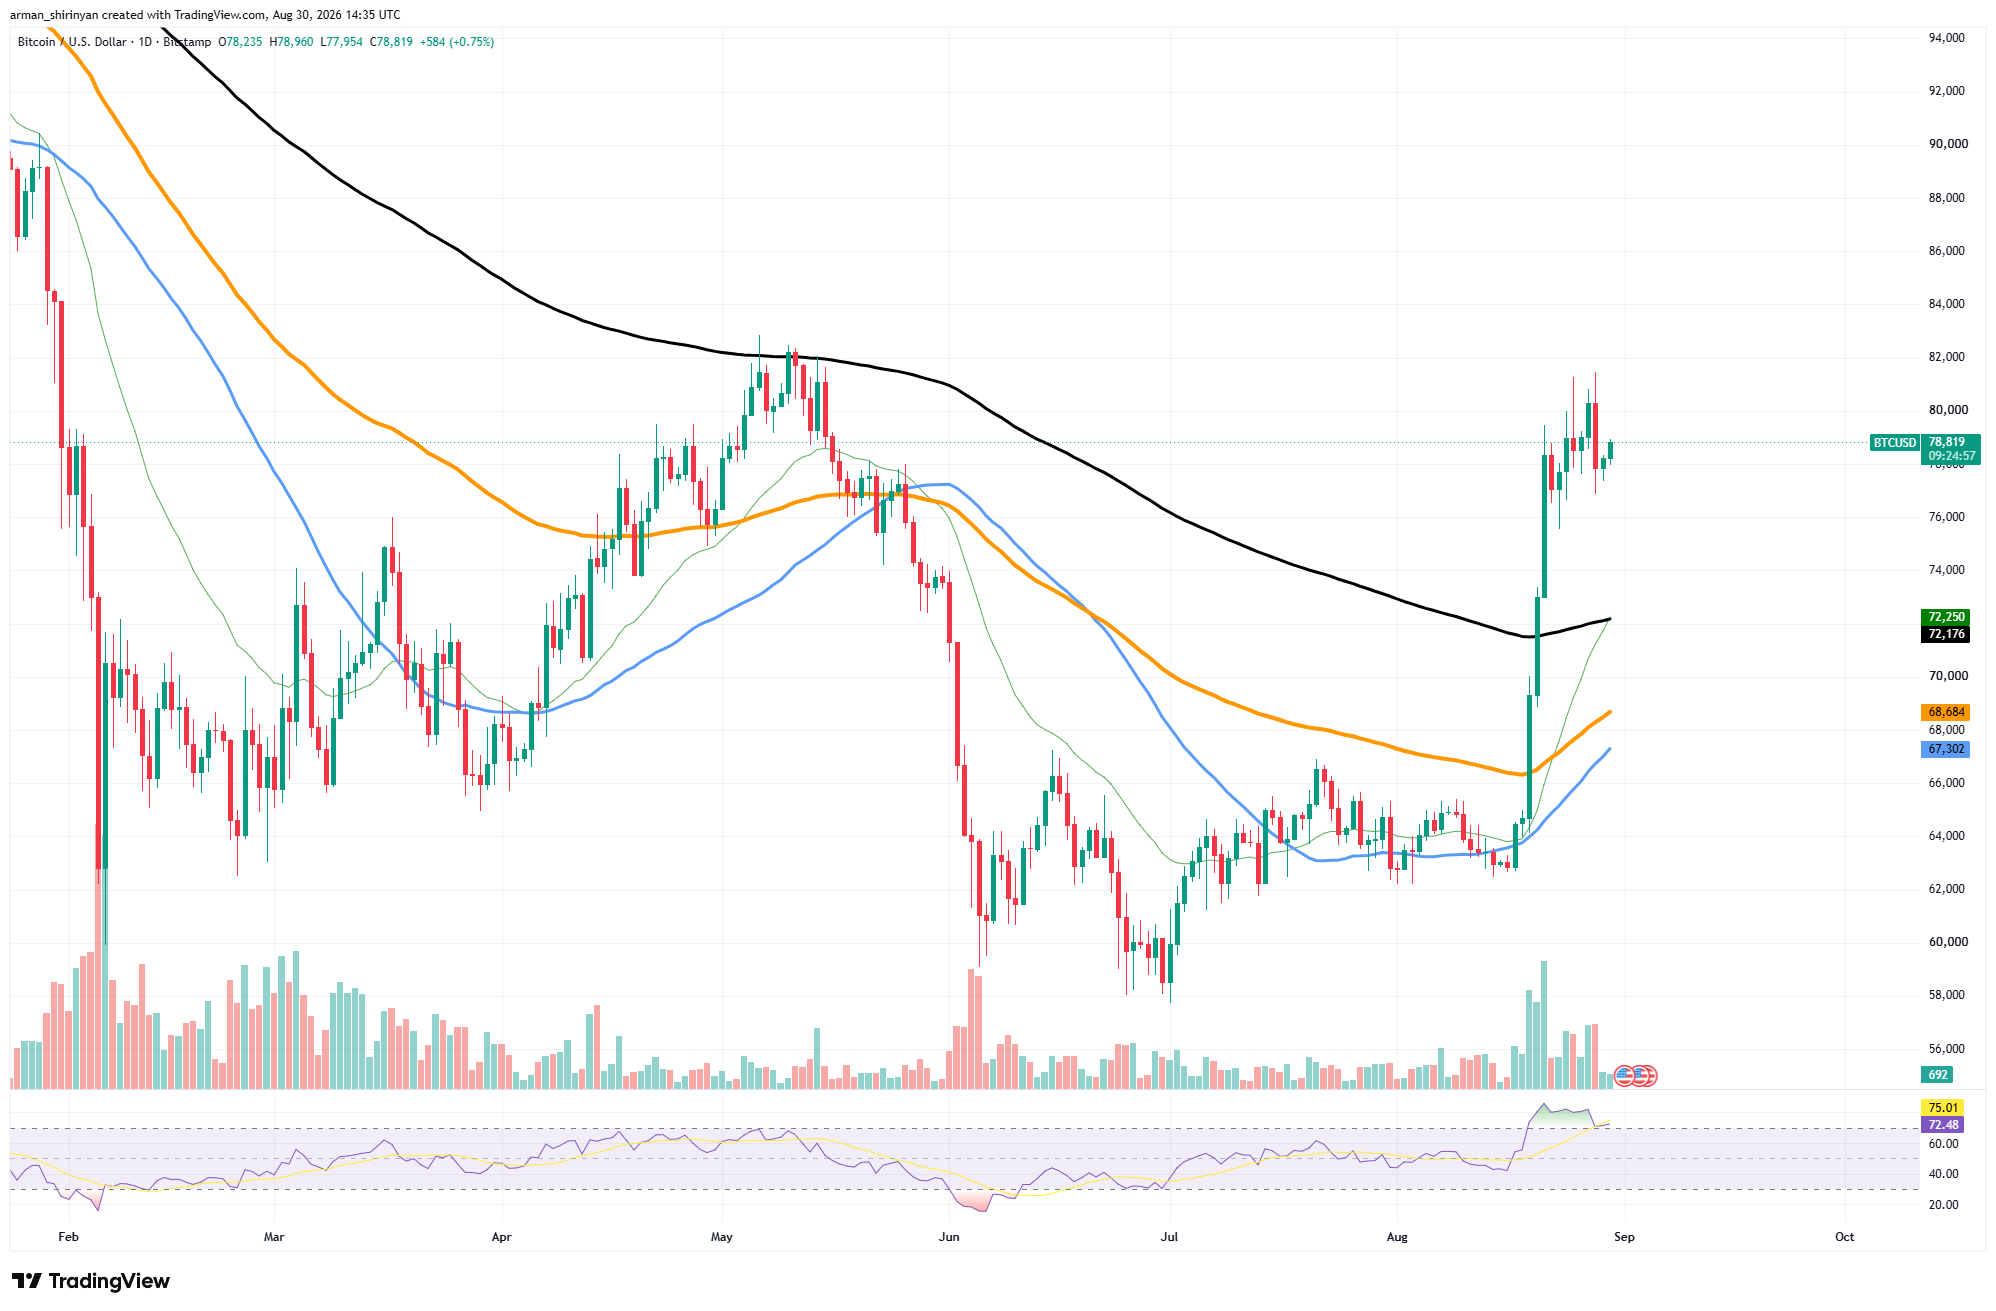
Sellers have not produced a significant retracement despite multiple erratic sessions near $80,000. The recovery of the 200-day moving average continues to be the strongest technical development. The rapidly rising 20-day EMA has reached roughly $72,250, while this indicator is currently at about $72,180. Their convergence around $72,000 establishes a crucial support area.
Bitcoin's consolidation isn't stopping yet
Additionally, Bitcoin is trading well above its 50-day and 100-day moving averages, which are currently at $68,680 and $67,300, respectively. In addition to confirming the breakout's strength, the separation demonstrates how far Bitcoin has risen in a comparatively short amount of time.
The RSI is still high at about 72.5. Bitcoin is still technically overbought even though it has decreased from its recent peak. This allows for more consolidation prior to another sustainable leg higher.
Both the most recent peak and Bitcoin's May high are located in the immediate resistance zone, which is between $80,000 and $82,000. Breaking $82,000 would provide a significant continuation signal in addition to removing the most obvious nearby technical barrier. $76,000–$77,000 is the first short-term support on the downside.
$72,000 would become more relevant with a deeper correction. The larger reversal continues as long as Bitcoin stays above its recovered 200-day average. Although chasing the price is becoming riskier due to the elevated RSI, the current sideways movement near $80,000 appears more like post-breakout consolidation than a confirmed reversal.
After one of its biggest breakouts of 2026, XRP is consolidating, and the most recent daily structure indicates that buyers are still in charge of the larger recovery despite the decline from $1.70. After rising from an intraday low of about $1.38, XRP is currently trading at about $1.41. The significant development is still that it is at about $1.35 above the 200-day moving average.
XRP stays on the bullish path
During the August surge, XRP firmly reclaimed this indicator, and it has since spent multiple sessions above it. Because of this, the $1.35 region is the chart's most crucial support. The claim that the prior long-term downward trend has been broken would be strengthened by a successful defense.
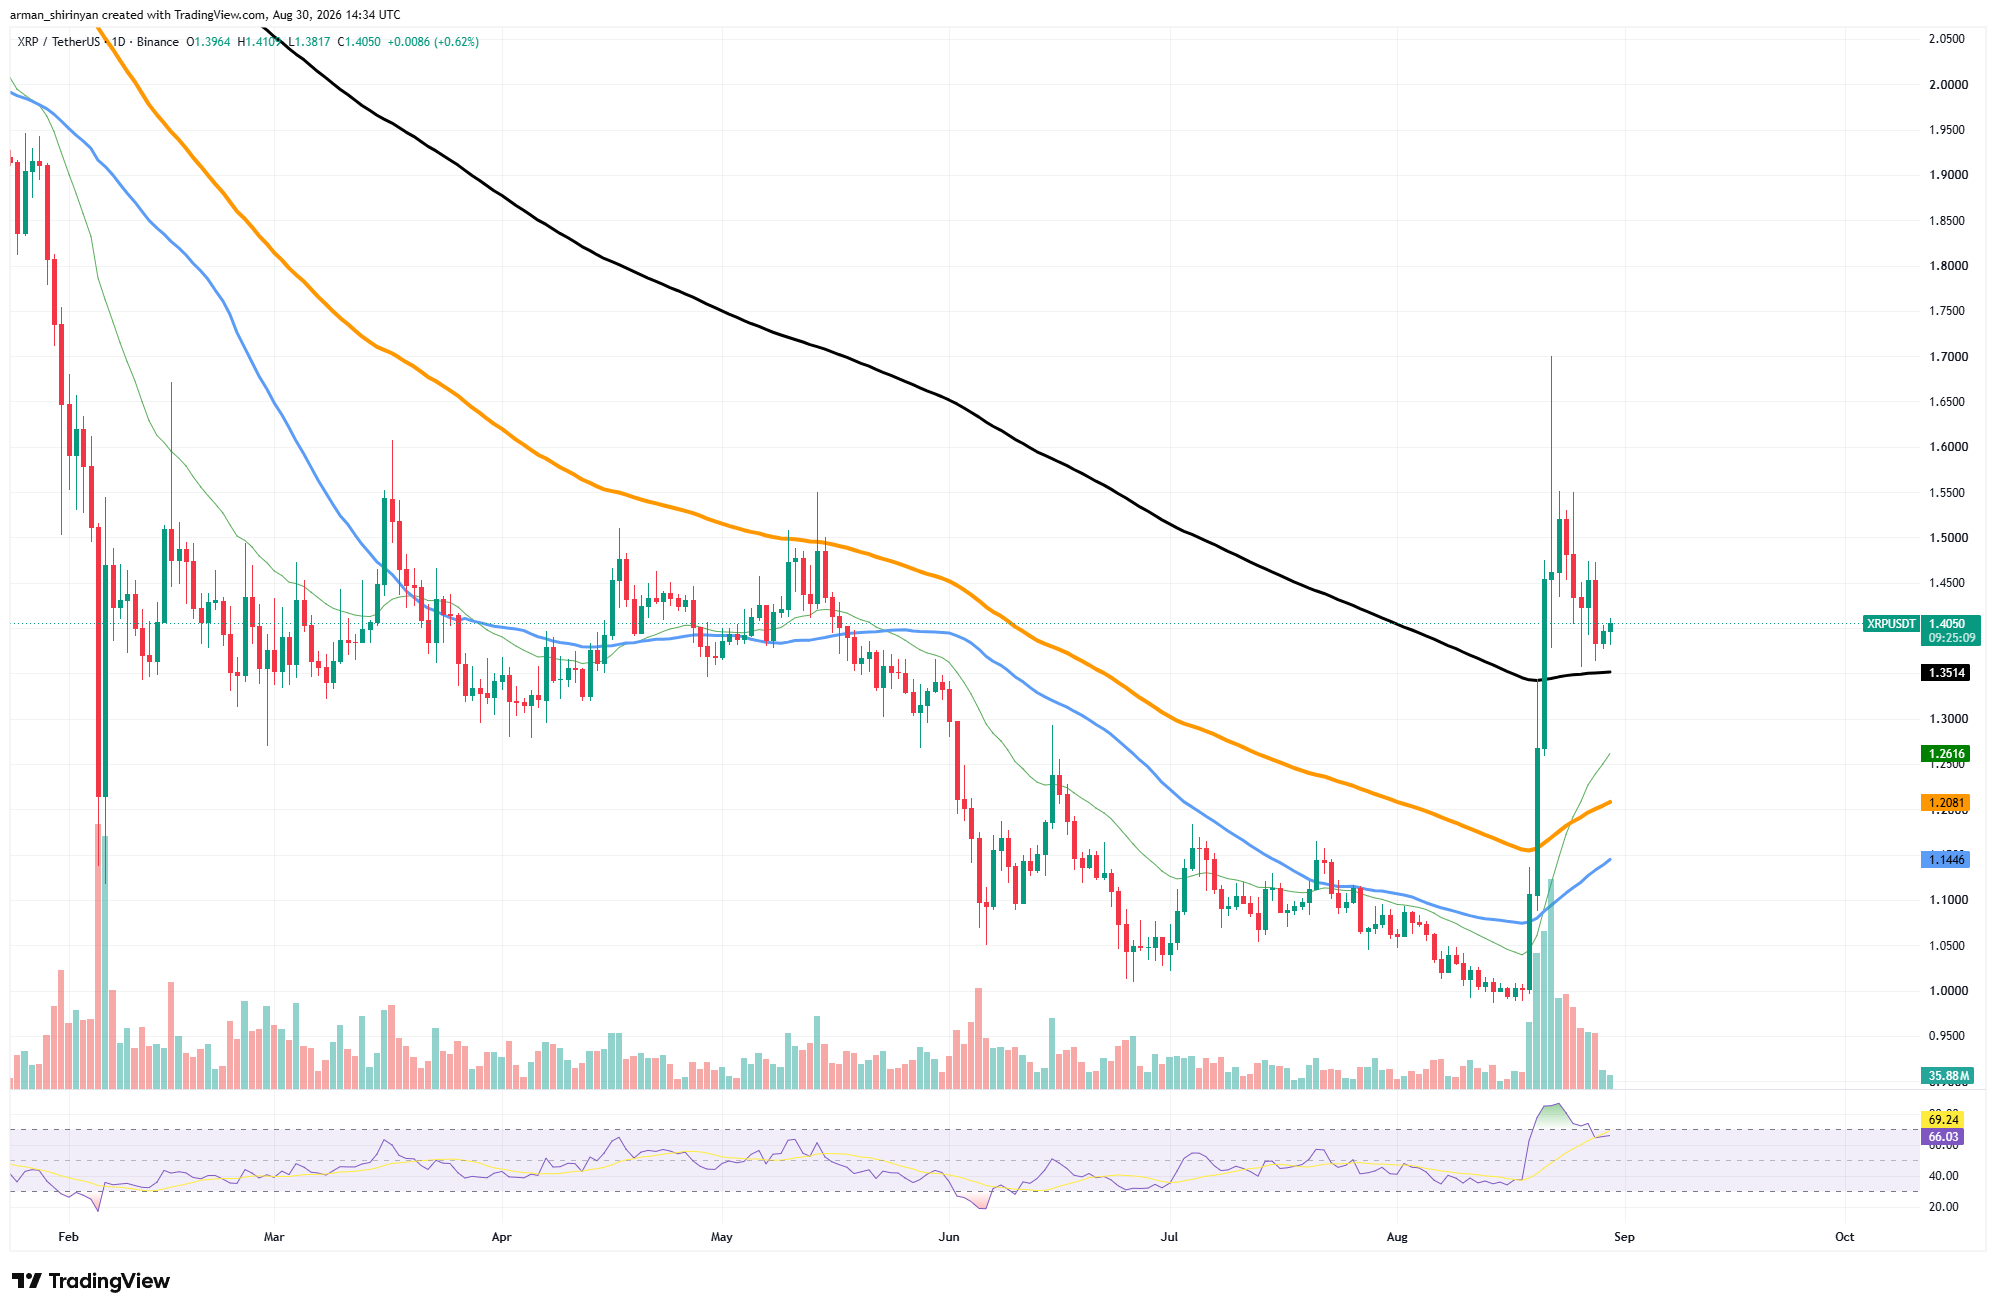
However, a daily close below it would put XRP at risk of a more severe correction. The shorter moving averages are still significantly lower. The 50-day average is close to $1.14, the 100-day average is at $1.21, and the 20-day EMA has accelerated to about $1.26.

This significant gap illustrates how rapidly XRP rose from its August low of about $1.00. Momentum is also returning to normal. After moving well into overbought territory, the RSI is now close to 66. Because of this cooling process, XRP may have more room for a subsequent upside attempt without producing an extremely high momentum reading right away.
The first significant barrier is still between $1.45 and $1.50. After the initial breakout, XRP has had trouble sustaining its momentum above this region. Attention would move to $1.55 and ultimately the $1.70 spike high if $1.50 were cleared.
Technically speaking, XRP is still bullish above $1.35. A consolidation between that level and $1.50 would probably be preferable to another sudden vertical move, in order to allow the shorter moving averages to catch up with price.
Ethereum's strong positioning
Following its August breakout, Ethereum is still in an exceptionally strong position, holding hundreds of dollars above its recently recovered 200-day moving average while consolidating around $2,470. ETH is currently trading close to $2,472 after rising quickly from about $1,900.
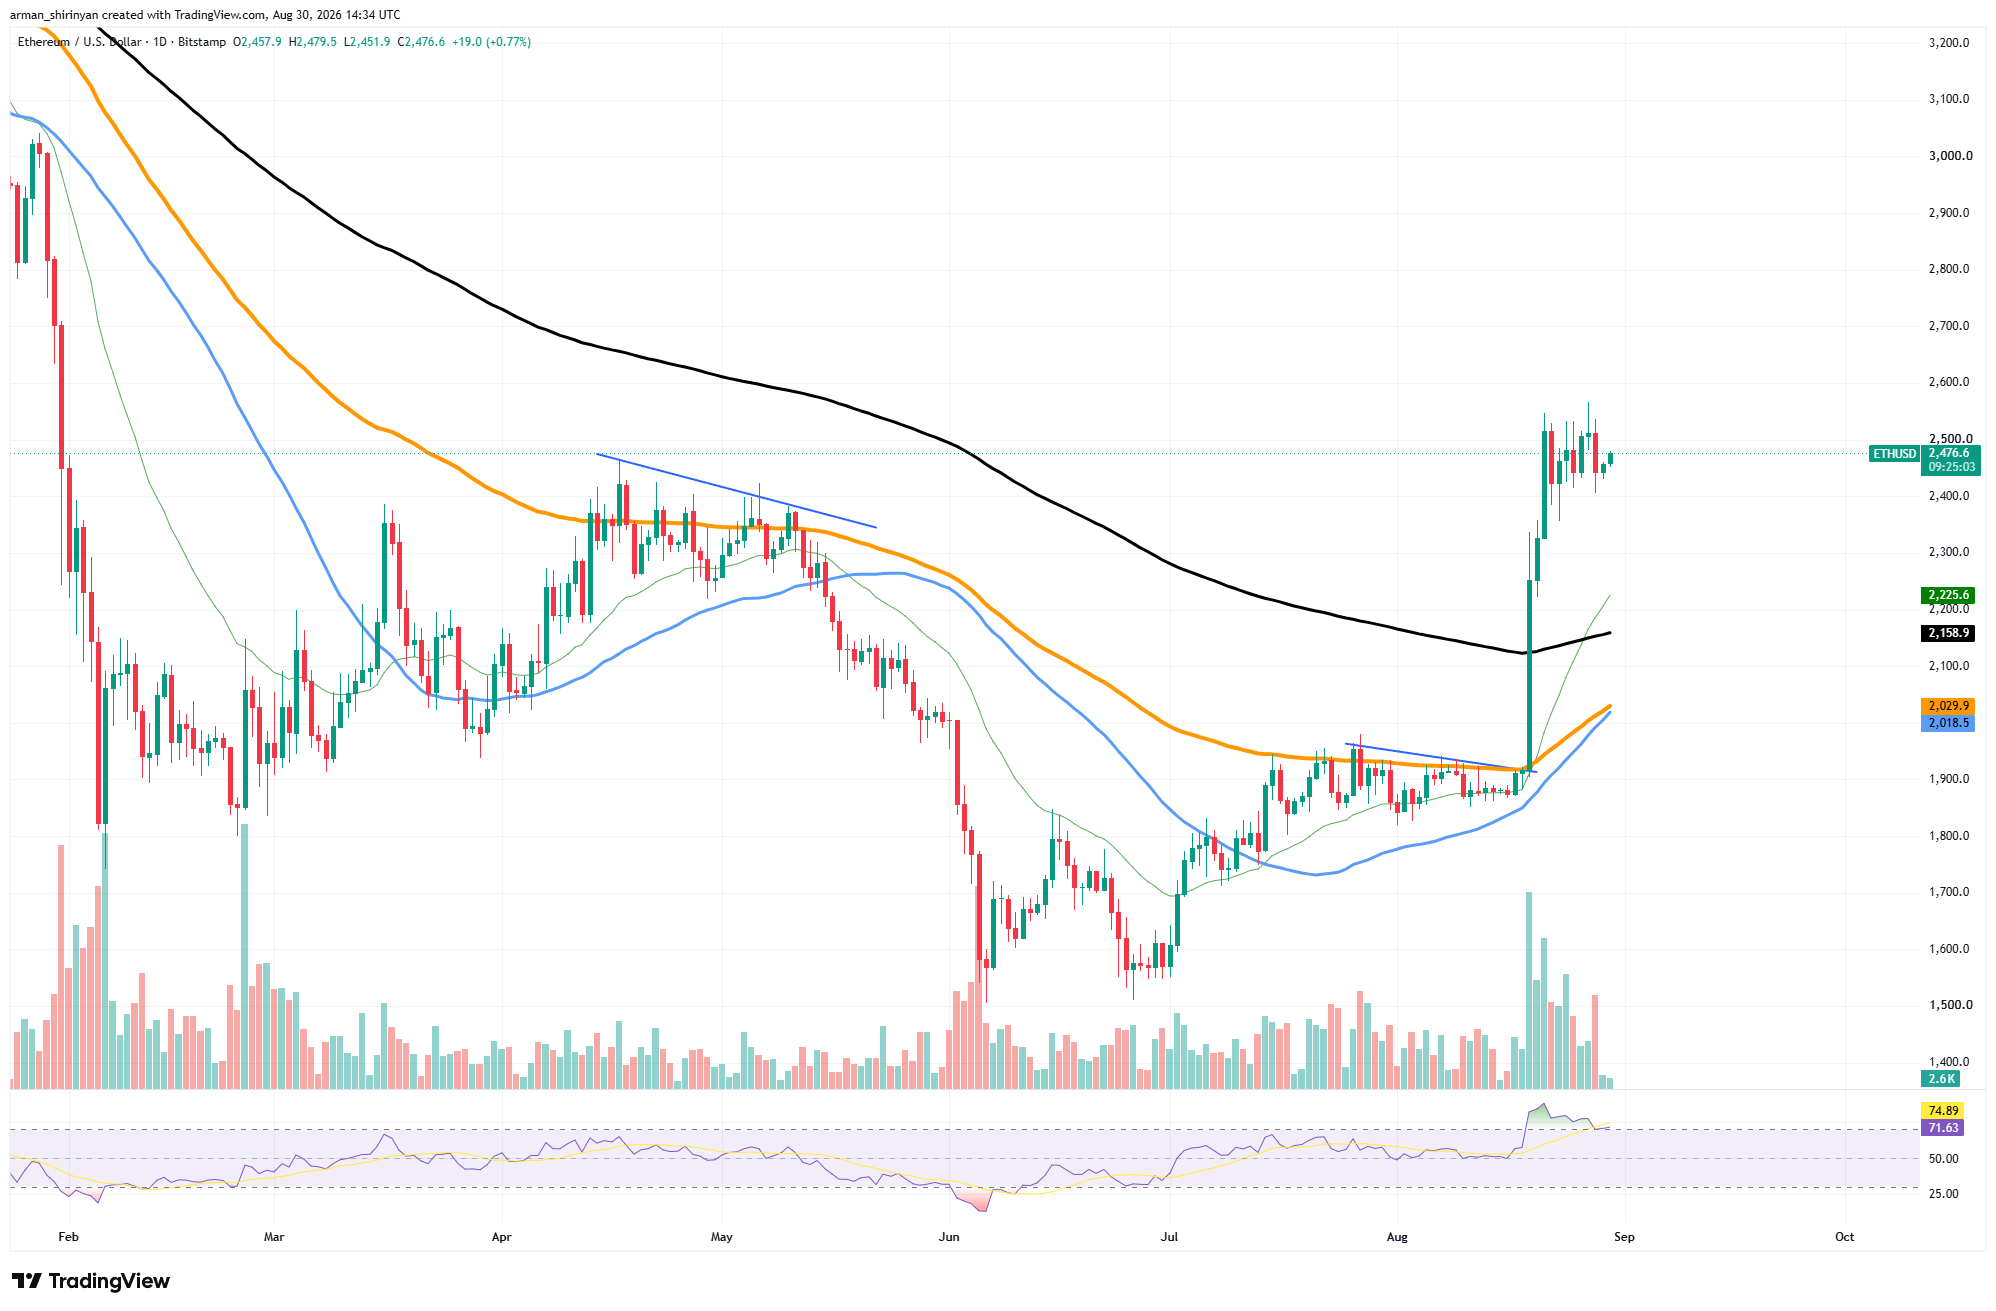
Almost simultaneously, the breakout forced Ethereum through a number of resistance levels, including the declining 200-day moving average at $2,159. It is an important move. The 20-day EMA has risen to $2,225, while ETH is currently about 14% above its 200-day average.
At roughly $2,030 and $2,019, respectively, the 50-day and 100-day moving averages are still much lower. Breaking the long-term trend indicator is no longer Ethereum's immediate concern.

Rather, buyers must build a solid structure above it and prevent the current consolidation from becoming a more significant retracement. The immediate resistance area is now between $2,500 and $2,550. This zone has been tested by several recent candles without resulting in a lasting breakout.
Additionally, volume increased sharply during the initial breakout before falling during the consolidation. Lower volume during a sideways phase is not inherently bearish, as it may suggest that aggressive selling has not followed the rally. The quickly rising 20-day EMA at $2,225 is currently the first significant dynamic support.
The 200-day average at $2,159 becomes the critical level below it. The present consolidation supports continuation as long as Ethereum stays above those levels. Breaking $2,550 would be the next sign that buyers are prepared to extend the August reversal.
Shiba Inu's long-term direction
After its August comeback, Shiba Inu is still struggling with long-term resistance, but the most recent decline has moved SHIB into a support zone that may determine whether the rebound continues. Following a recent spike to roughly $0.00000620, SHIB is currently trading around $0.00000517.
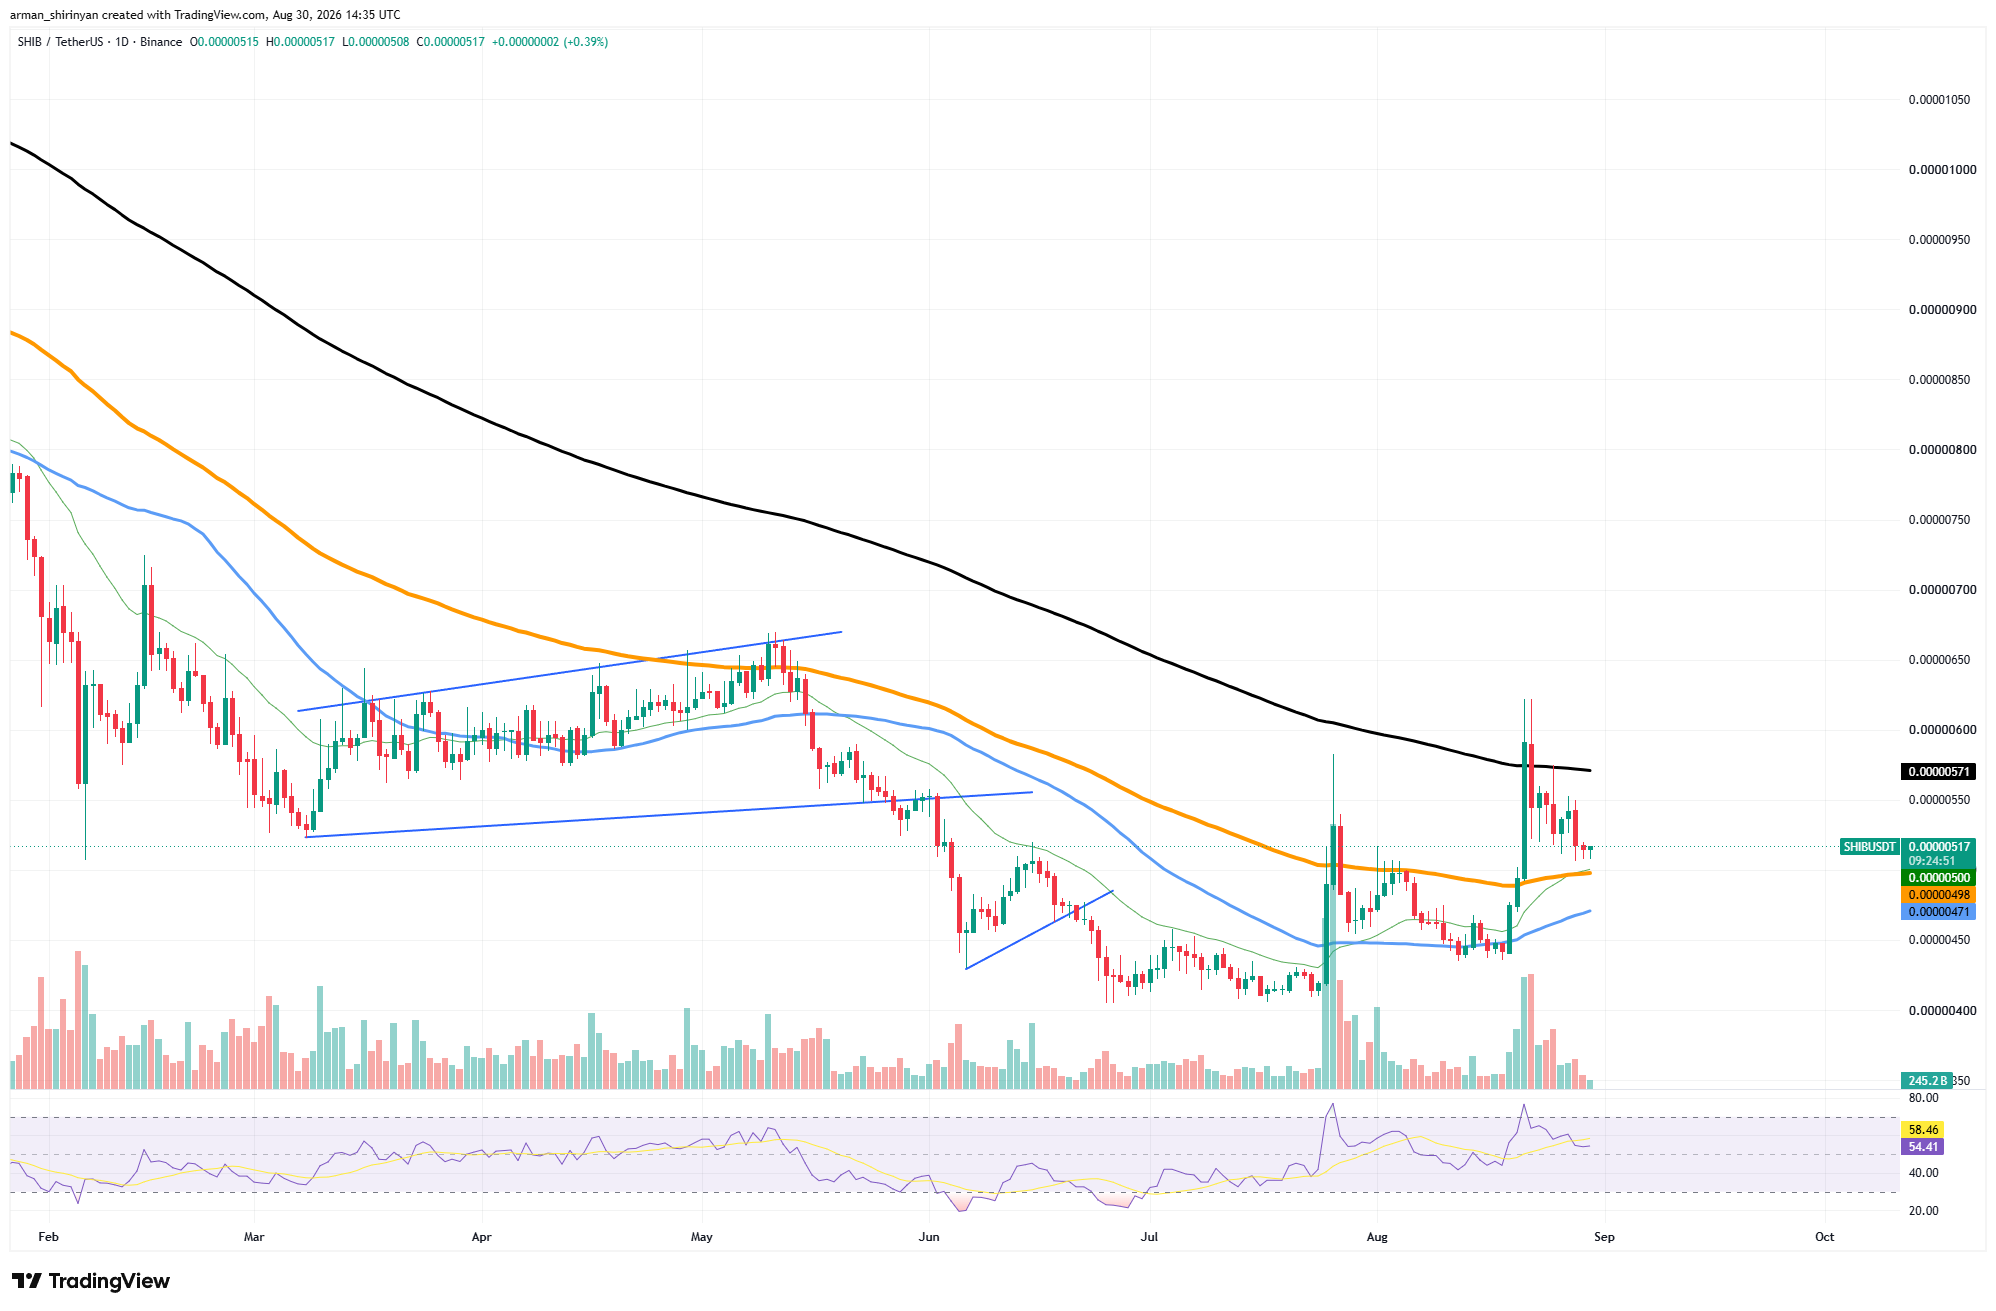
SHIB briefly rose above the 200-day moving average as a result of the move, but buyers were unable to hold that position. The indicator remains the biggest technical barrier on the daily chart and is currently located close to $0.00000571.
Because the 200-day average has served as long-term resistance during the larger downtrend, that failed breakout is significant. Before the market can establish a more convincing bullish reversal, SHIB needs to recover roughly $0.00000570–$0.00000580. The lower price is more favorable.

The 100-day moving average is close to $0.00000498, and the 20-day EMA has risen to about $0.00000500. As a result, there is a concentrated support area directly beneath SHIB. At roughly $0.00000471, the 50-day moving average is lower. Consequently, the critical short-term level is now $0.00000495–$0.00000500.
By holding it, SHIB could consolidate above its medium-term trend indicators and prepare for another attempt at the 200-day average. Momentum has already considerably decreased. The RSI is currently at 54, which is lower than the overbought levels reached during the August surge.
As a result, SHIB has considerably more room to move in either direction without momentum becoming a limiting factor. For a rebound from $0.00000500, resistance would first appear between $0.00000540 and $0.00000555, followed by the critical $0.00000571 level.
 U.Today Editorial Team
 Dan Burgin
