

Disclaimer: The opinions expressed by our writers are their own and do not represent the views of U.Today. The financial and market information provided on U.Today is intended for informational purposes only. U.Today is not liable for any financial losses incurred while trading cryptocurrencies. Conduct your own research by contacting financial experts before making any investment decisions. We believe that all content is accurate as of the date of publication, but certain offers mentioned may no longer be available.

Another rejection from the $81,000 region puts short-term pressure on the market, making it difficult for Bitcoin to maintain its August breakout. After briefly rising above $80,400, Bitcoin is currently trading close to $79,100, down about 1.5 percent on the daily candle. The larger framework is still favorable.
Bitcoin snaps
After moving quickly from about $63,000 to $80,000, Bitcoin is still trading well above its major moving averages. The 200-day average is currently close to $72,700, while the 20-day moving average has increased to about $75,450. Both offer strong support below the current consolidation.
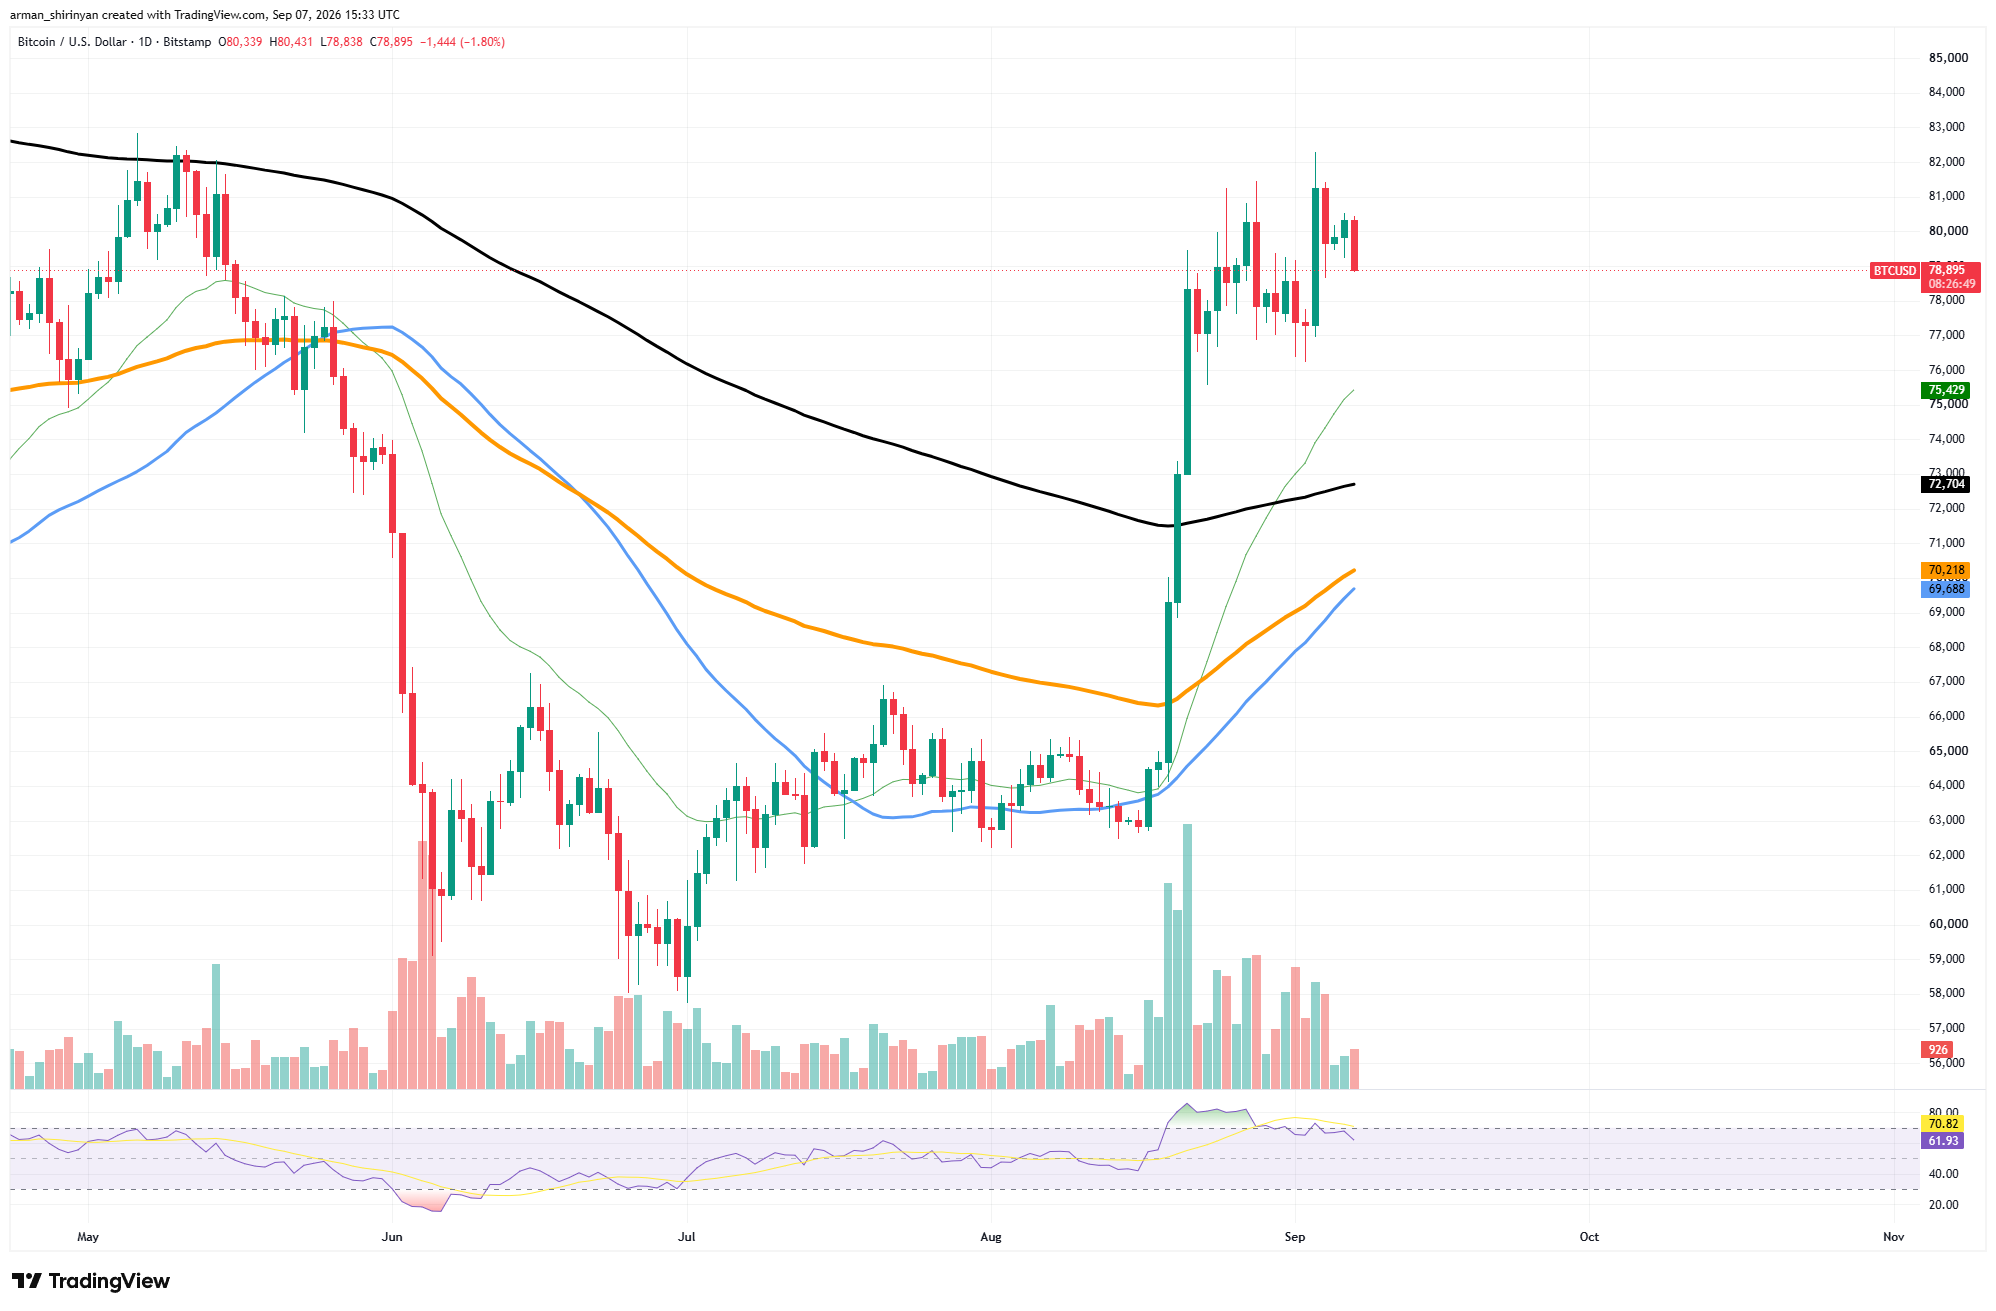
But the resistance range of $81,000 to $82,000 is becoming more and more significant. Bitcoin has made multiple attempts to rise above $80,000, but buyers have consistently been unable to maintain momentum near the most recent highs.

Additionally, the RSI has dropped from overbought levels to roughly 63, indicating that the initial breakout momentum is waning. A close above $82,000 would restore momentum and possibly pave the way for $85,000.
On the downside, the first support area is still $77,000 to $78,000. Bitcoin could move toward the 20-day average of about $75,500 if there is a breakdown there.
Is Uniswap ready to recover?
With UNI trading at about $7 following an incredible surge from roughly $3.20 in mid-August, Uniswap is exhibiting significantly stronger momentum. In less than a month, the token has more than doubled, and it recently hit about $7.50. Although it is becoming more stretched, the technical structure is very bullish.
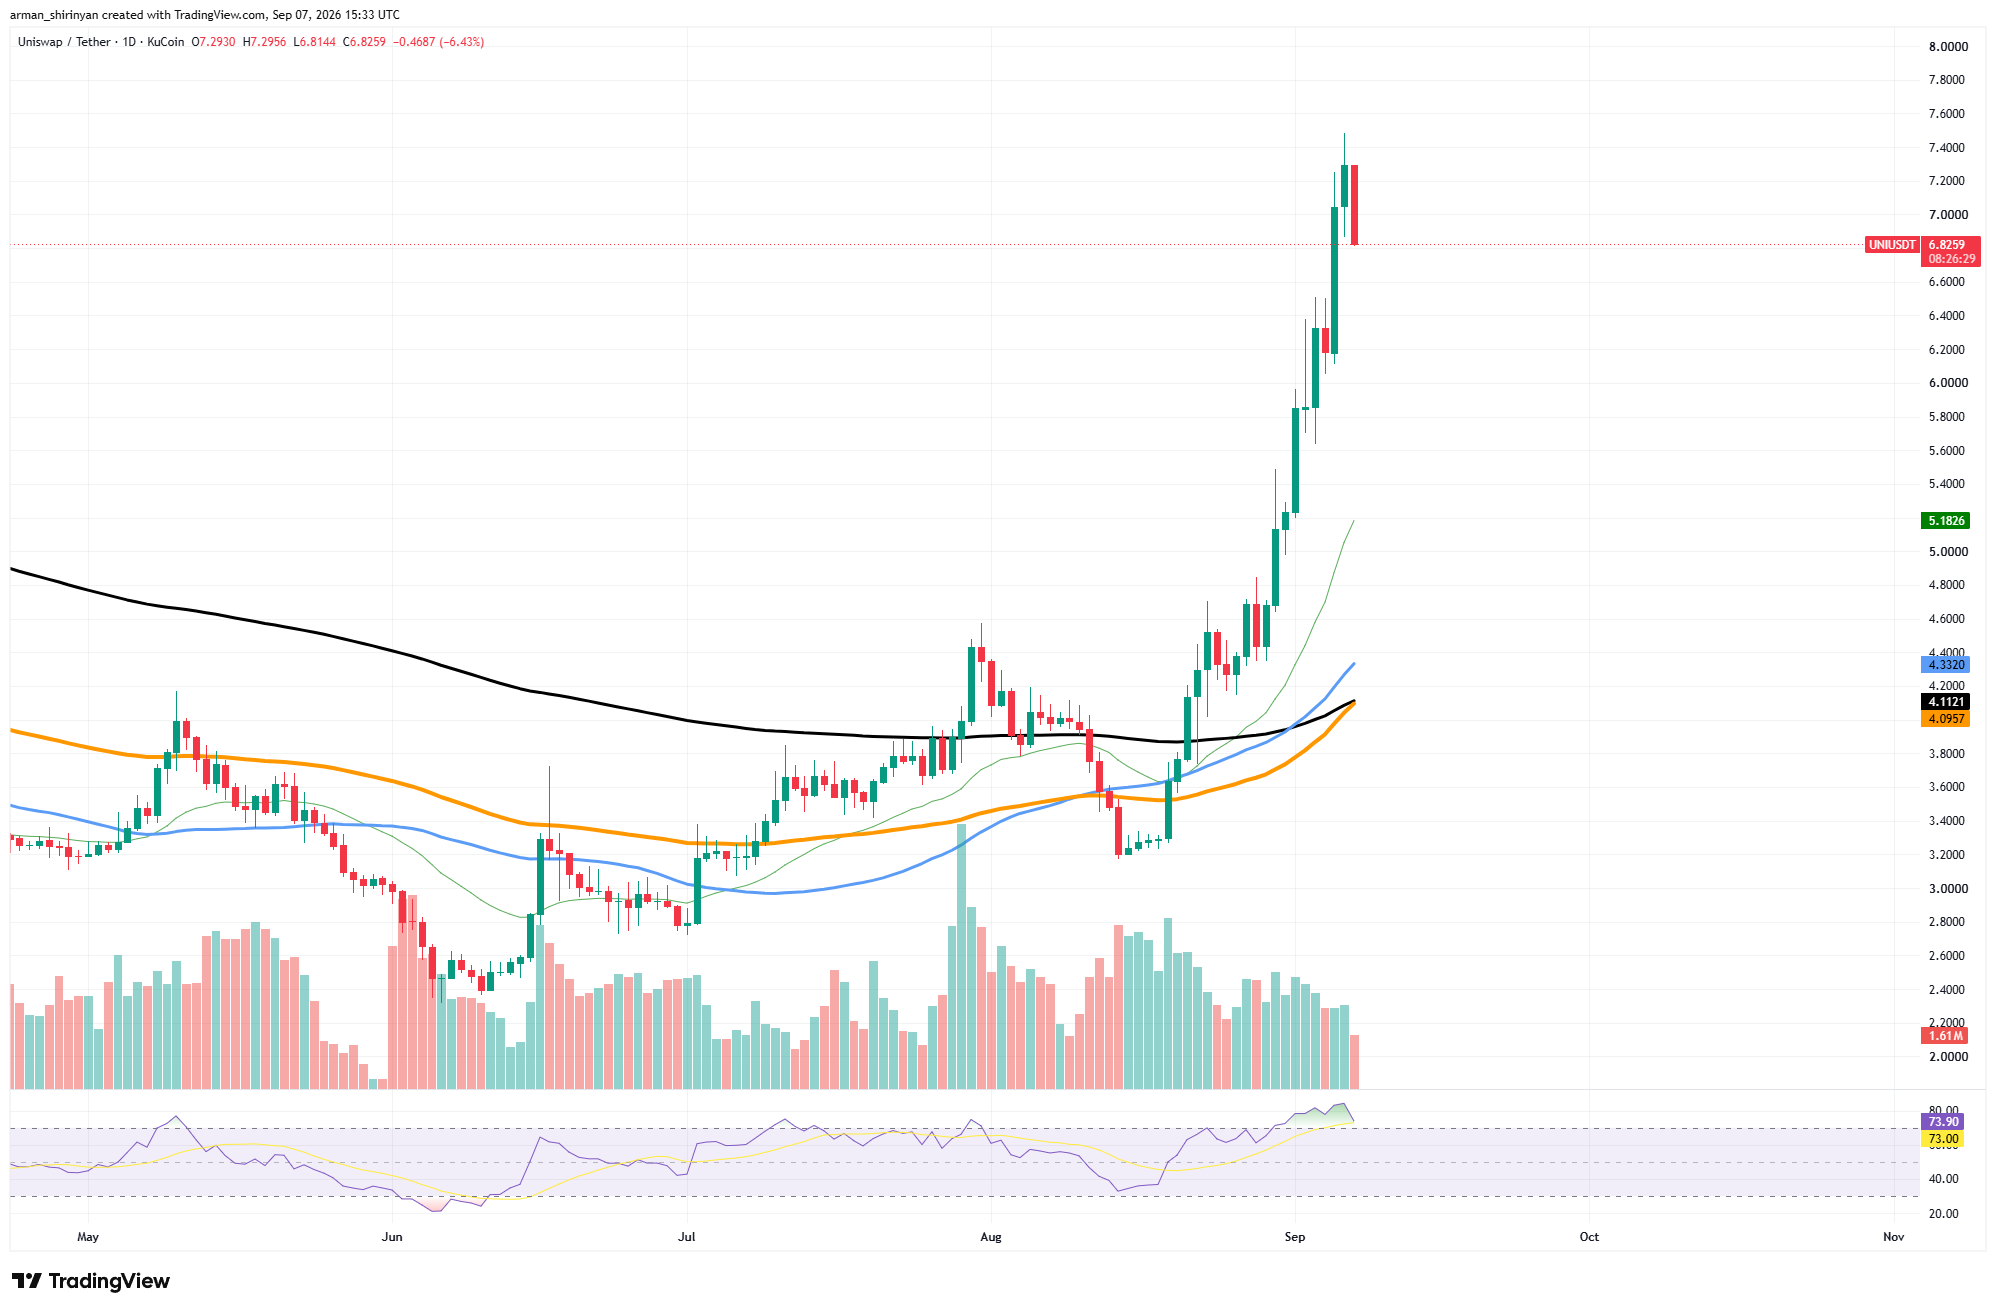
While the other major averages are still grouped around $4.10–$4.34, UNI is trading at $5.20, well above its 20-day moving average. This separation demonstrates the strength of the breakout and also raises the likelihood of a brief correction.
Right now, the RSI is well inside overbought territory, hovering around 78. Rather than a confirmed reversal, the most recent red daily candle following the move toward $7.50 might be the first indication of profit-taking.

UNI must recover $7.30–$7.50 in order to proceed. $8 could then become the focus of a breakout. In the event that momentum wanes, the first significant support zone is between $6.20 and $6.40, which is followed by the rising 20-day moving average close to $5.20.
XRP's breakout is close
The sustainability of XRP's August breakout is being tested as selling pressure resumes at about $1.40. Although the asset has dropped more than 2% during the session, it is still above the most significant long-term technical level on the chart at $1.39.
Since the initial surge, the 200-day moving average, which is currently at $1.35, has served as support multiple times. During recent intraday trading, XRP briefly dropped below this level, but buyers swiftly pushed it back up.
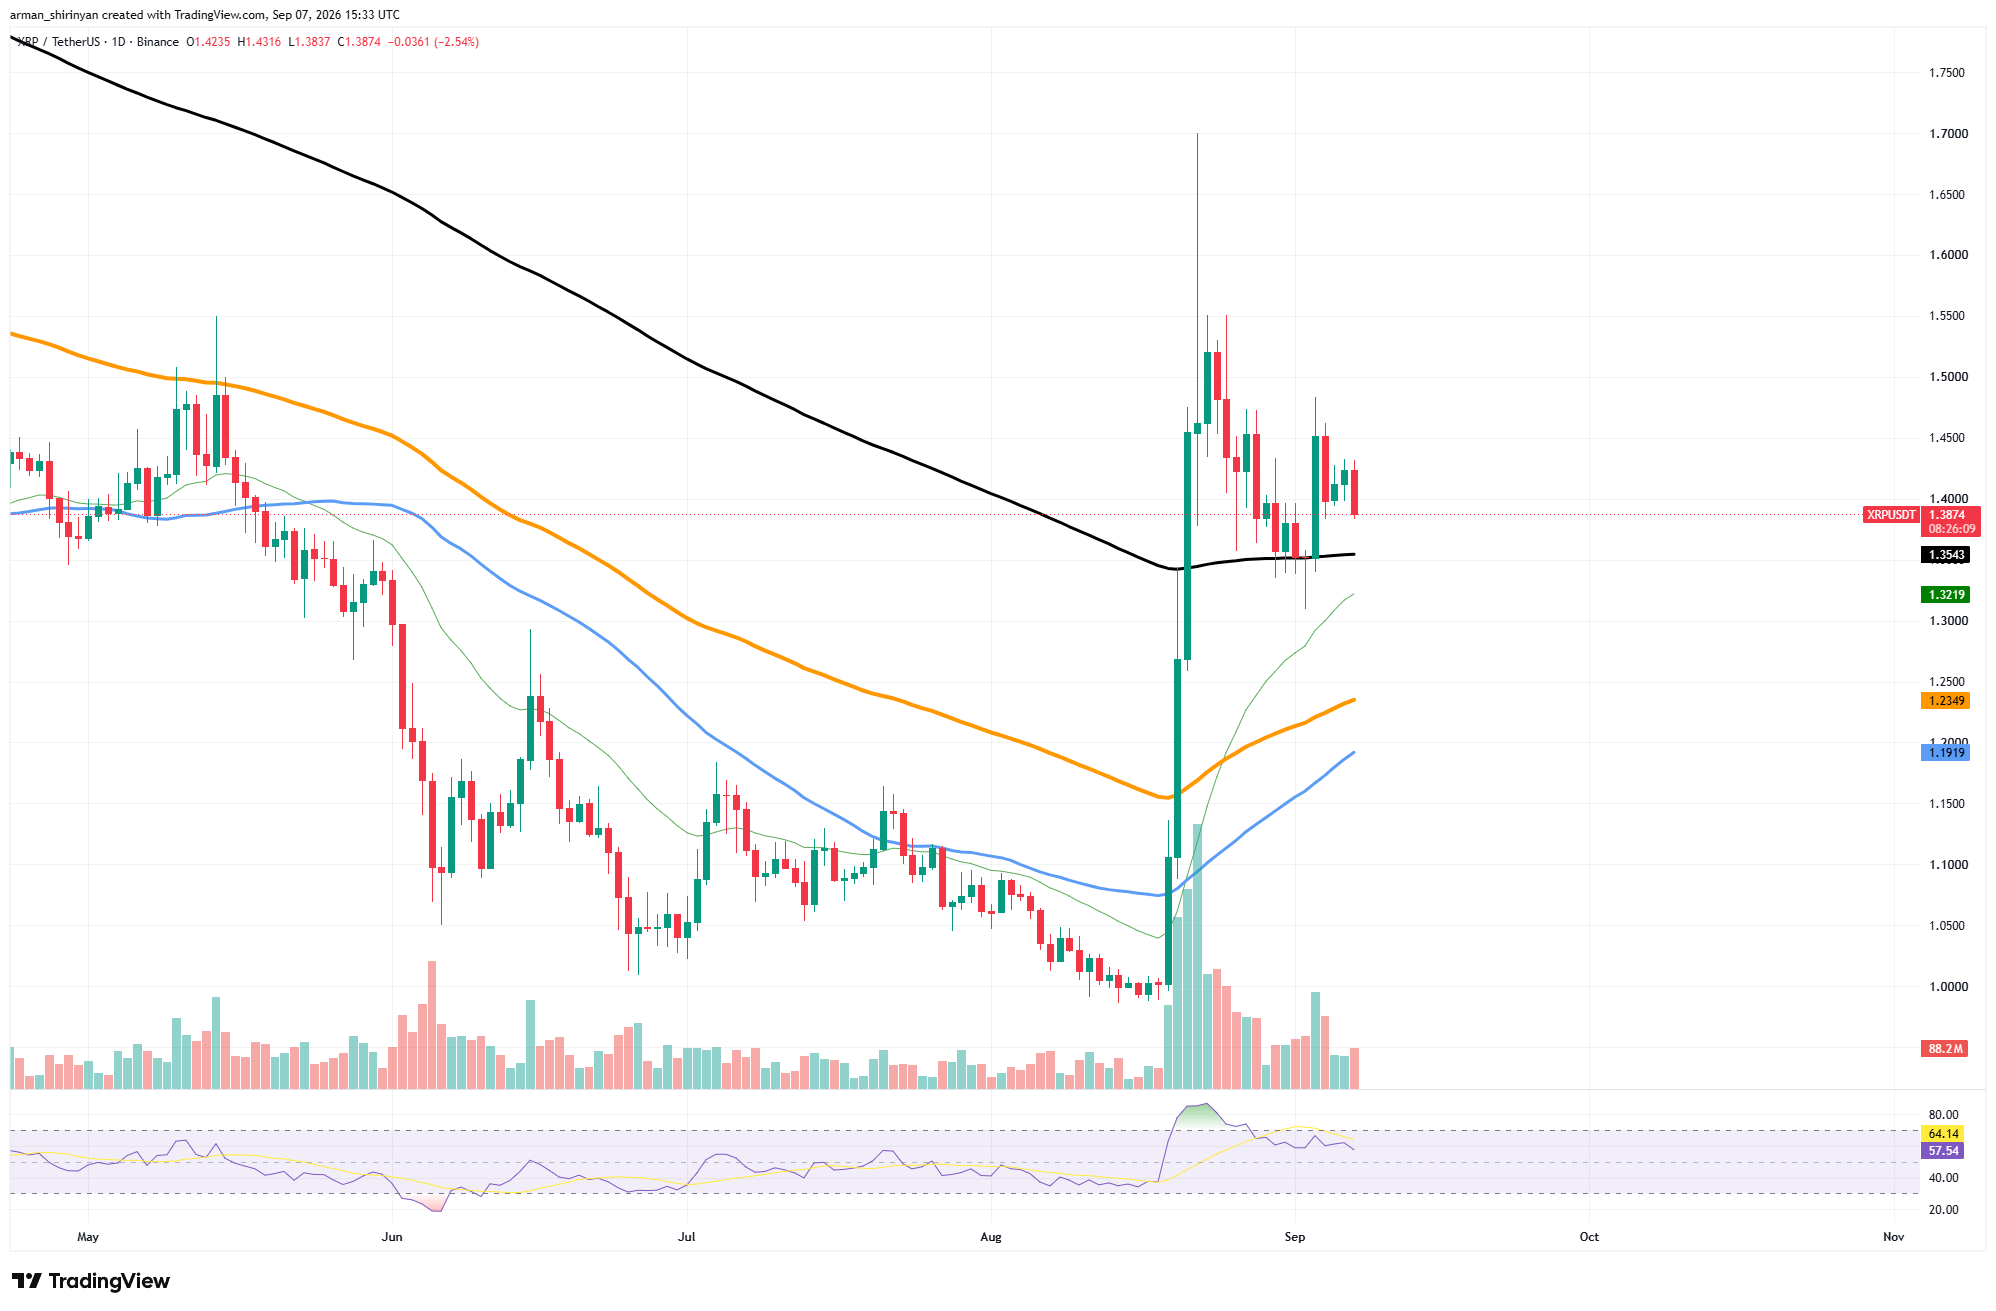
The August breakout structure is still in place as long as $1.35 holds on daily closes. The more immediate picture is not as compelling. After the initial surge toward $1.70, XRP has frequently failed around $1.45–$1.50, resulting in lower local highs. Additionally, the RSI has dropped to about 58, indicating a significant slowdown in momentum.

A rebound above $1.45 would refocus attention on $1.50–$1.55. The path toward $1.70 could be reopened if that zone is broken. On the other hand, losing $1.35 would expose the rising 20-day moving average at about $1.32.
The next significant support level is around $1.23 below that. XRP's overall structure remains optimistic for the time being, but the $1.35 support is becoming increasingly crucial.
Ethereum is a slugfest
Following its massive August breakout, Ethereum is still consolidating around $2,500; it is currently trading at $2,484. In contrast to XRP, Ethereum has sustained the majority of its early gains without experiencing a notable decline. A distinct consolidation range appears on the chart between roughly $2,400 and $2,550.
While attempts above $2,500–$2,550 continue to face resistance, buyers have frequently stepped in around the lower boundary. Ethereum remains comfortably above all of its major moving averages.

While the 200-day moving average is at about $2,182, the 20-day average has risen to about $2,335. The overall trend is clearly positive, with the intermediate averages sitting lower at roughly $2,093–$2,115. After cooling from overbought territory, the RSI is currently close to 63.
This slowdown in momentum without a significant drop in price is a positive sign, as ETH has successfully used sideways trading to release some of its overheated conditions. A daily close above $2,550–$2,560 would be the next significant bullish confirmation. Such a breakout might expose $2,600 and then $2,650.
On the downside, a break below $2,400 would weaken the current consolidation and raise the likelihood of a correction toward the $2,335 20-day moving average.
 Dan Burgin
 U.Today Editorial Team
