

Disclaimer: The opinions expressed by our writers are their own and do not represent the views of U.Today. The financial and market information provided on U.Today is intended for informational purposes only. U.Today is not liable for any financial losses incurred while trading cryptocurrencies. Conduct your own research by contacting financial experts before making any investment decisions. We believe that all content is accurate as of the date of publication, but certain offers mentioned may no longer be available.

Following its explosive August breakout, XRP is trying to create a stable bullish structure. Although the asset is currently trading comfortably above the major moving averages at $1.42, price action since the initial surge indicates that buyers are still having difficulty resuming the advance.
Support range for XRP
Right now, the 200-day moving average is around $1.35, which is the most crucial level. Since late August, XRP has conducted numerous tests in this area without yielding a conclusive breakdown. Thus, $1.35–$1.36 is the main support range. This area is further strengthened by the 20-day moving average, which is also coming in from below at roughly $1.32. $1.45 is the initial resistance on the upside.
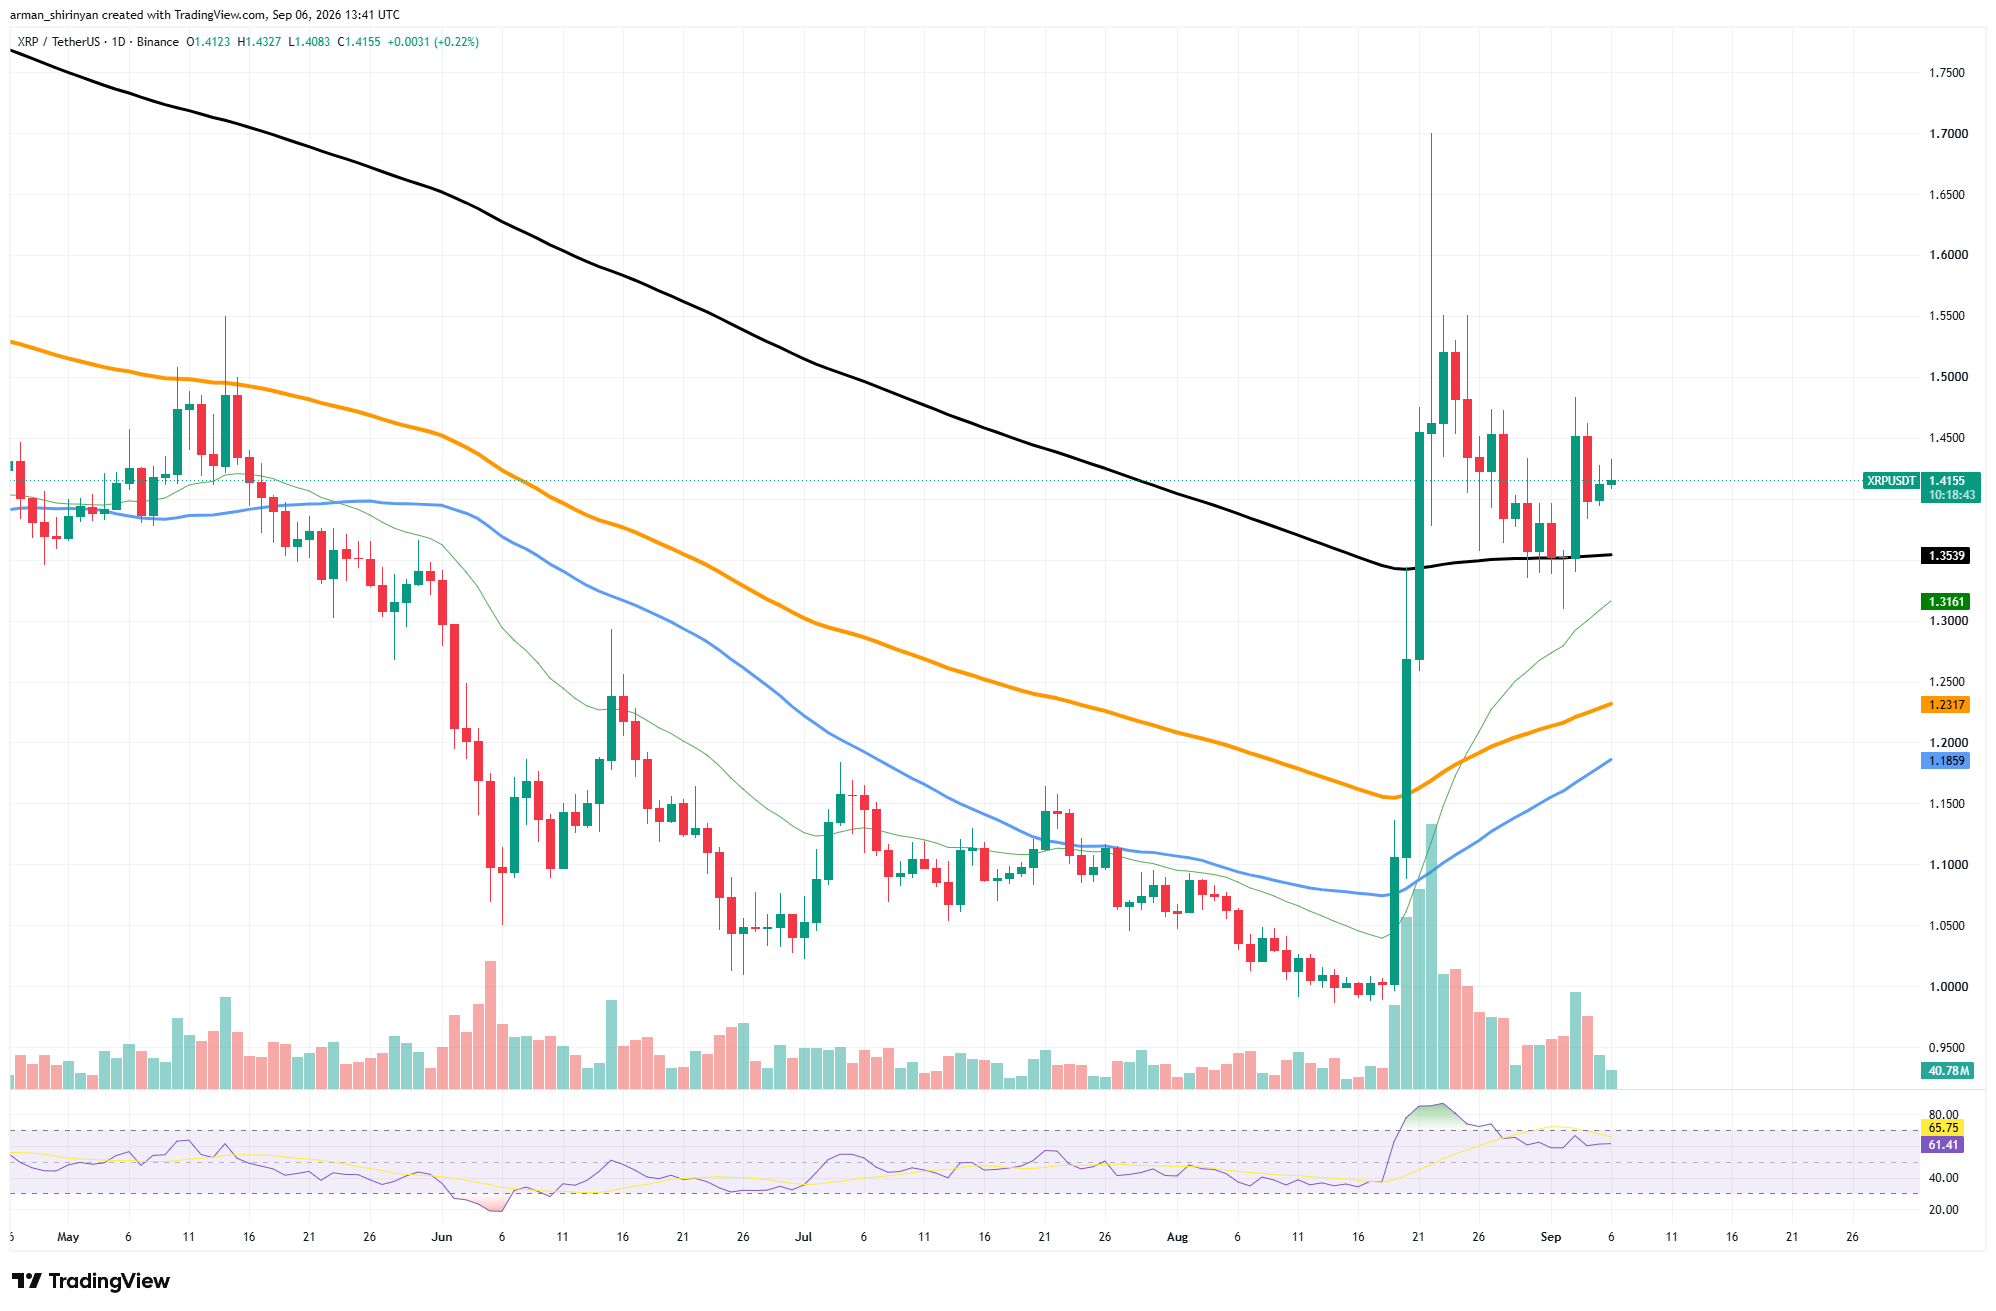
Another attempt at $1.50–$1.55, where XRP previously encountered significant selling, could be opened by a clean daily close above it. The price spent very little time at the extreme wick toward $1.70, so it should not yet be considered established resistance. The momentum is still in favor.

The RSI is currently at about 62, significantly lower than the overbought readings produced during the August breakout. As a result, XRP can continue to grow without becoming technically overheated.
Bulls currently benefit from consolidation above $1.35. The recovery would be significantly weakened if that level were lost, and $1.32 and then $1.23 would come into focus.
Solana stays above
After gaining more than 3% during the current session, Solana has maintained one of the cleaner recovery structures on the chart, trading at about $106.50. SOL is currently trading above all of the major moving averages displayed, having recovered significantly from its June lows.
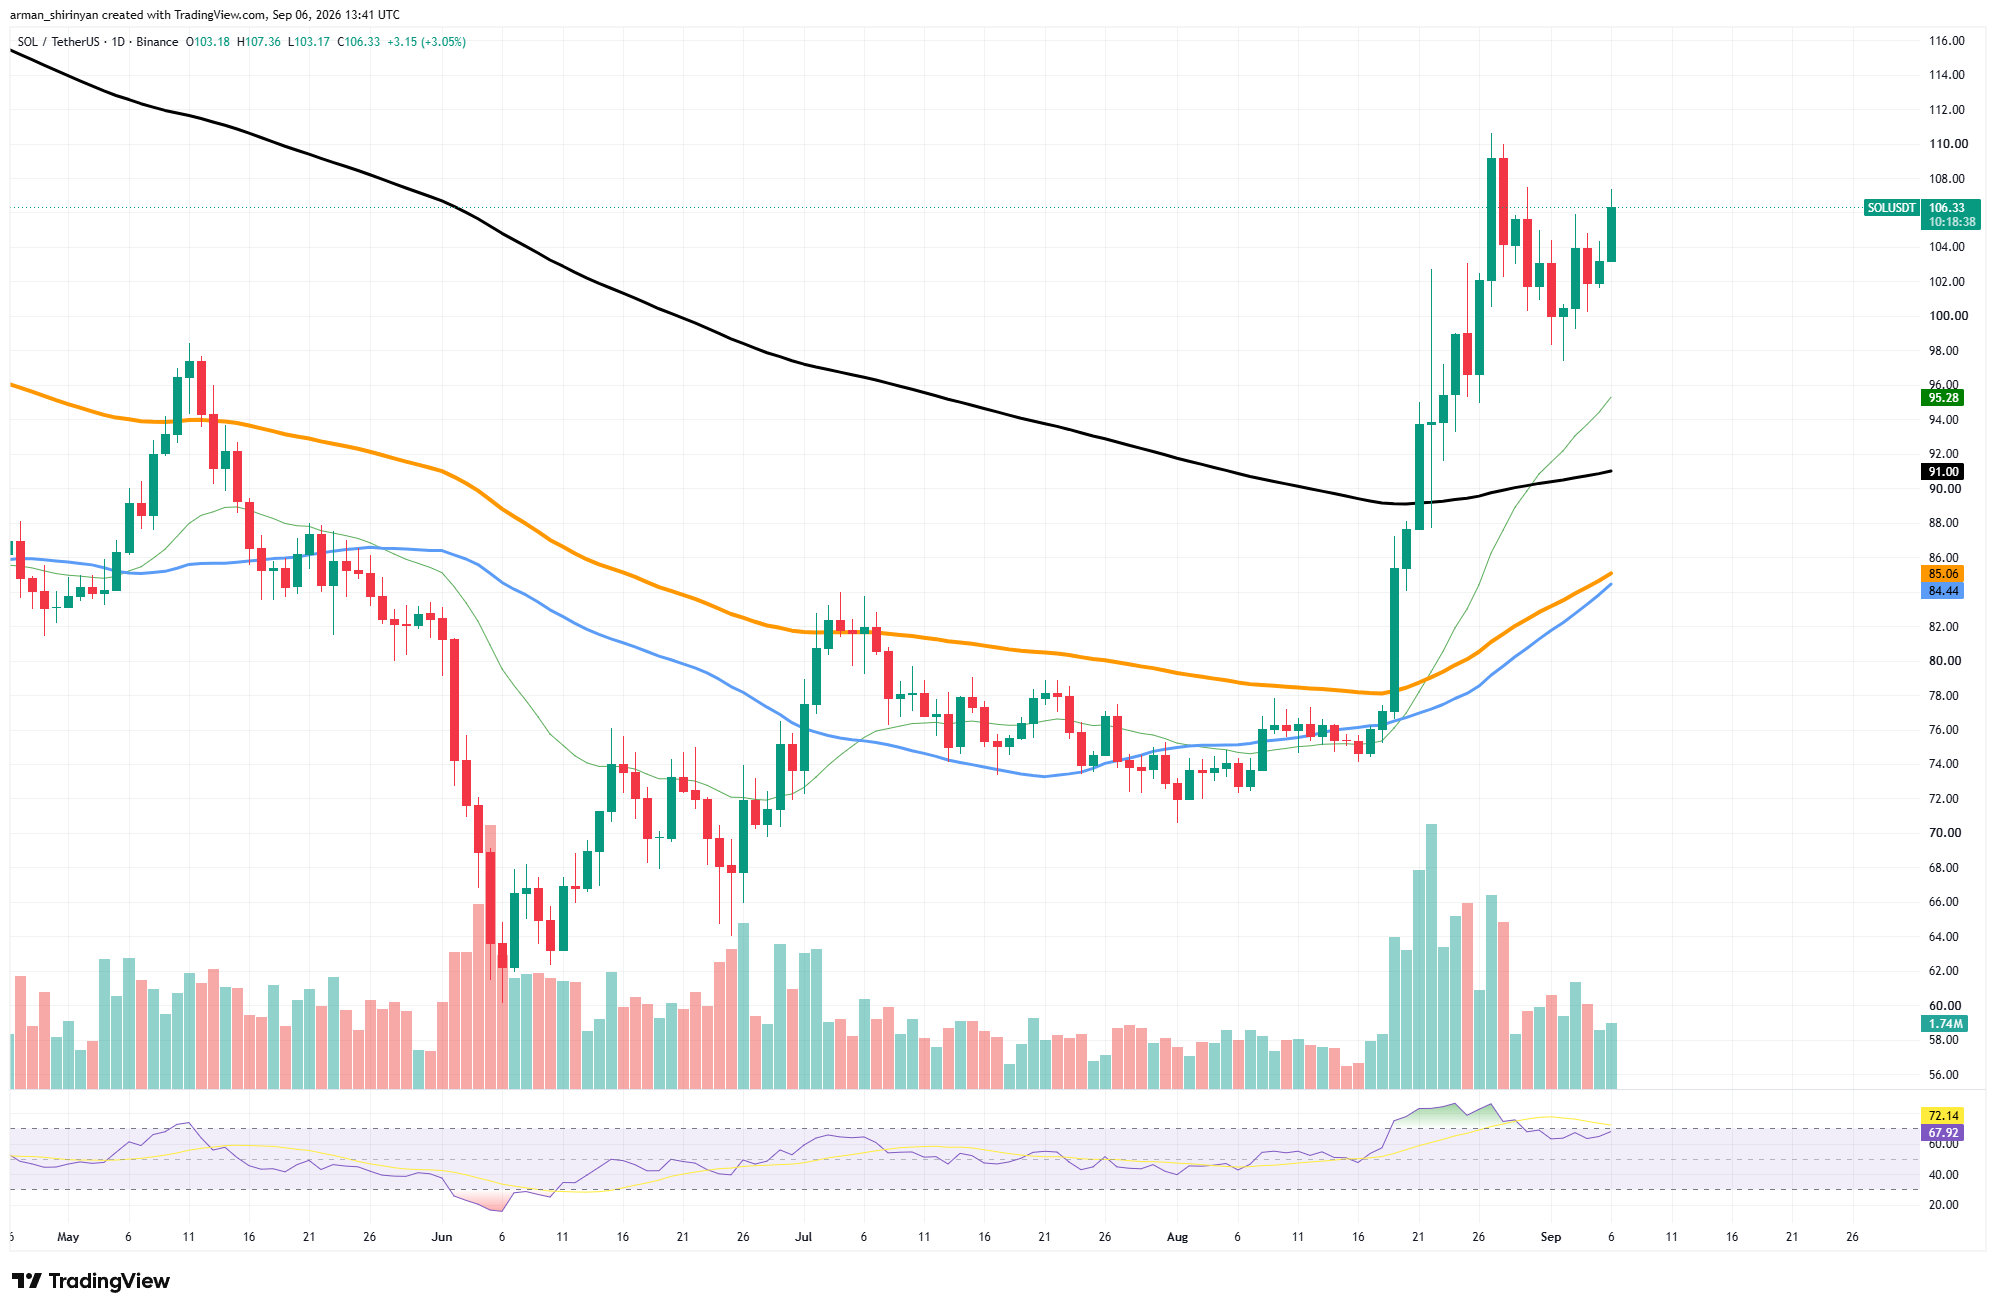
The $108–$110 range is the current obstacle. Before going into consolidation, SOL hit about $110 during the late-August rally, and buyers have not yet been able to break that high. There would not be much technical resistance in the vicinity if the price continued to rise through $110.

Support has emerged between $100 and $102, where buyers have been drawn in by a number of recent pullbacks. The next significant dynamic support is the rising 20-day moving average around $95.30 below that. Another significant structural level is the 200-day average of about $91.
Although there is still plenty of momentum, caution is advised. The RSI is close to 68, and the signal average is above 72. As a result, even though SOL has cooled since the initial breakout, it is once again approaching overbought conditions.
The overall setup continues to favor buyers as long as SOL stays above $100. While losing $100 could lead to a deeper retracement toward $95 and possibly $91, breaking $110 would reinforce the bullish continuation scenario.
Hyperliquid near $100
With HYPE rising to about $89 after gaining more than 4% during the current session, Hyperliquid is still outperforming the overall market. The recent action continues the robust surge that started on August 18, when the value of the token was less than $60. The technical structure remains overwhelmingly bullish.
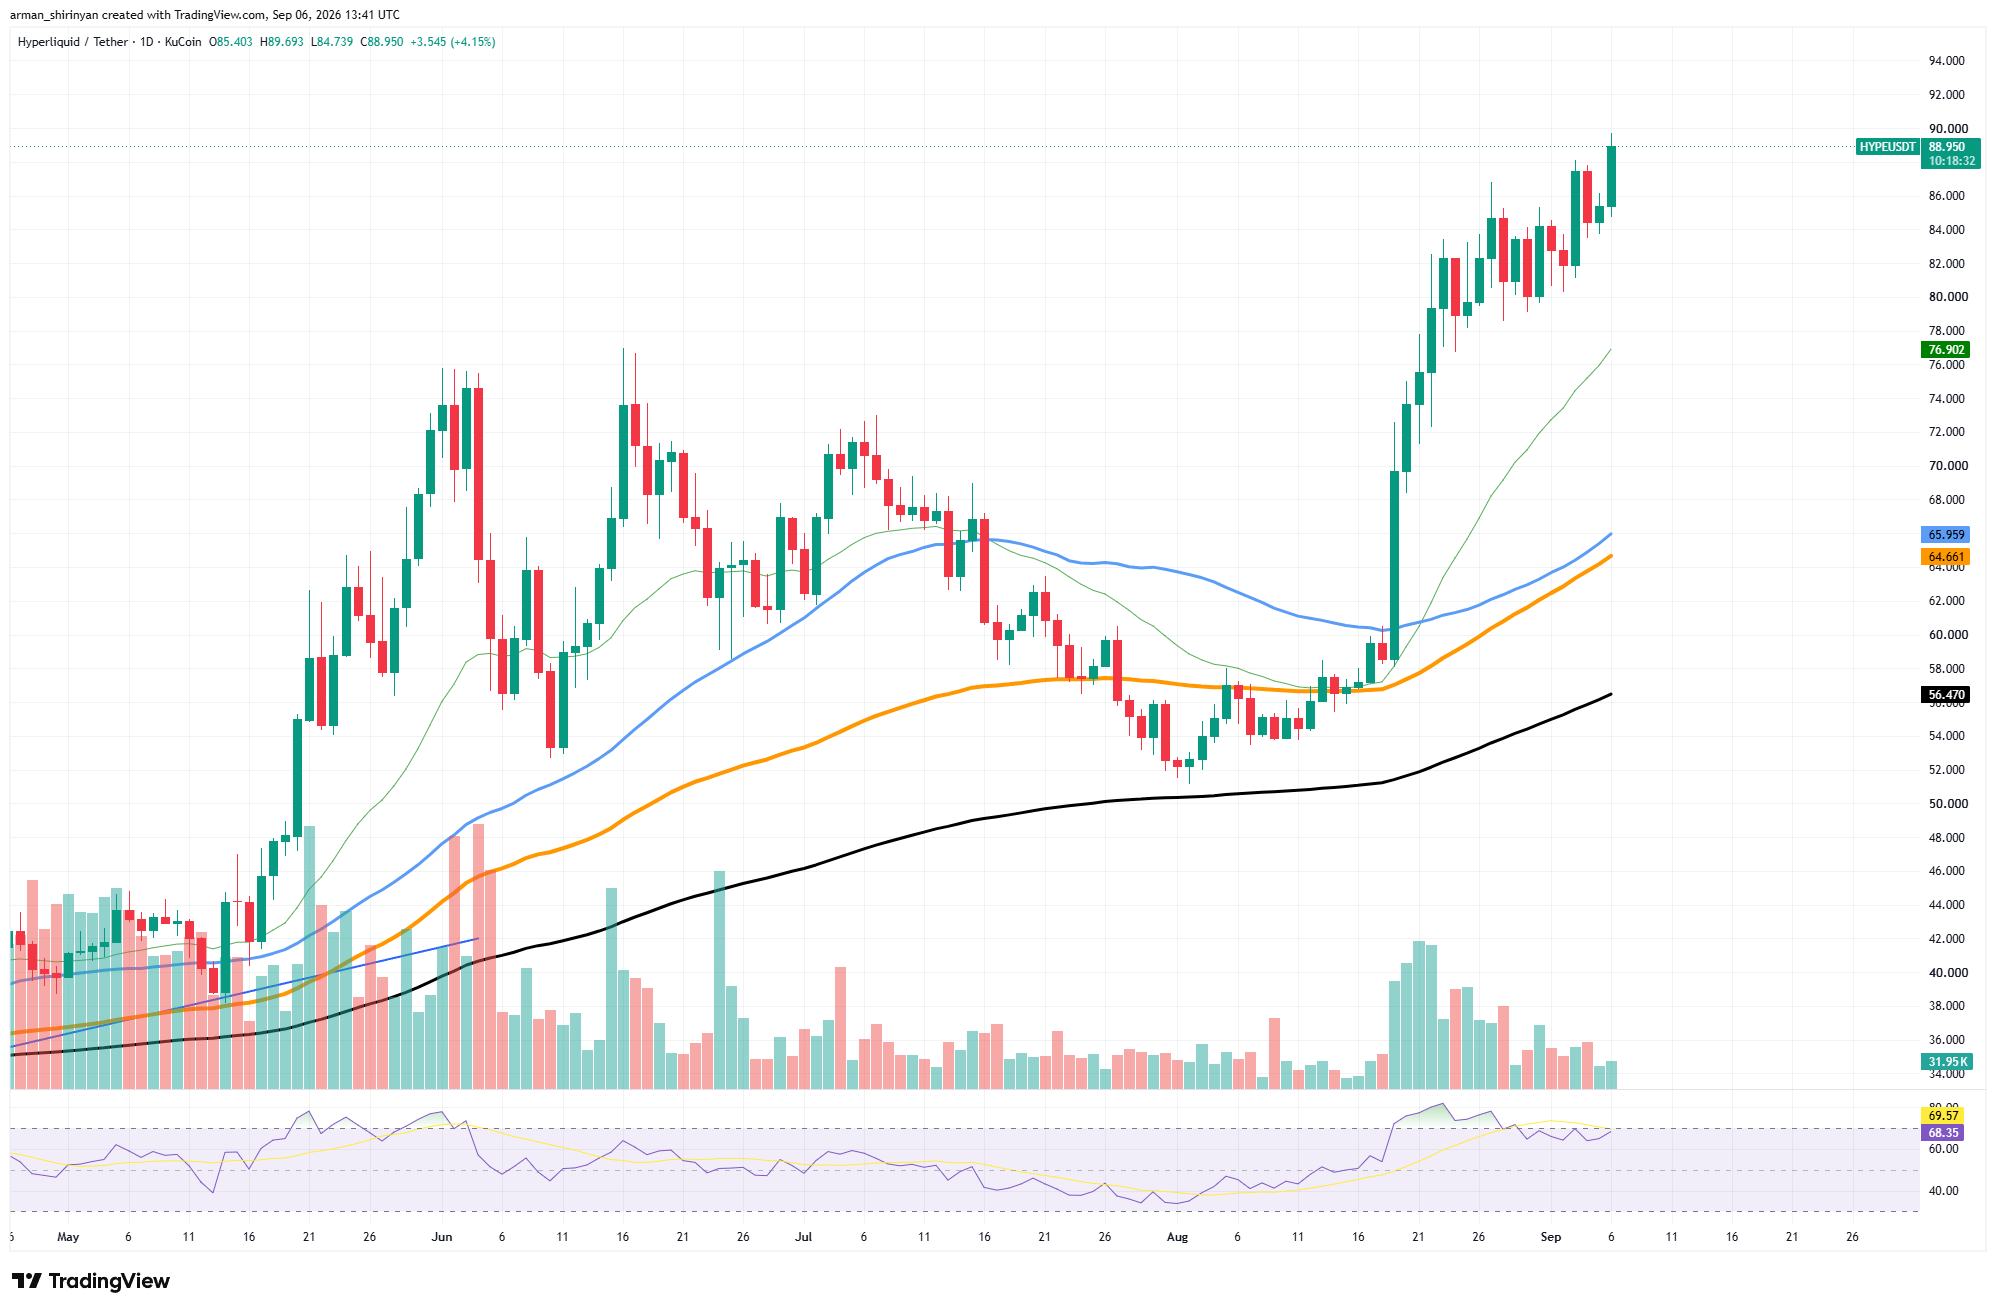
The price is currently far above all significant moving averages, and HYPE has continuously produced higher highs and higher lows. The longer averages are still centered around $64–$66, but the 20-day moving average has increased to about $76.91. At $56.47, the 200-day moving average is significantly lower.
The psychologically significant $90 area is now being tested by HYPE. The token would enter price discovery if there were a strong breakout above this level, with $92–$95 emerging as the next natural zone to watch. However, the gap between the price and its moving averages also reveals the extent of the rally.

Right now, the RSI is at 68.5, which is slightly below the conventional overbought level. It is worth noting that momentum has somewhat decreased even as HYPE hits new highs, which increases the likelihood of consolidation but also leaves the door open to further upside.
The first significant support is located between $84 and $85. The rising 20-day average around $77–$80 would become significant below that. HYPE's overall bullish structure does not change unless it loses these levels.
Bitcoin stands under pressure
After a strong breakout from about $63,000 in August, Bitcoin is still consolidating around $80,000. Although buyers have repeatedly failed to create a sustained move above $81,000, Bitcoin is currently trading close to $79,960.
Instead of a proven reversal, the current structure is more akin to high-level consolidation. Demand for Bitcoin has consistently been found between $77,000 and $78,000; the most recent surge briefly pushed the price above $81,000 before being rejected once more. $81,000–$82,000 is now the most immediate resistance range.
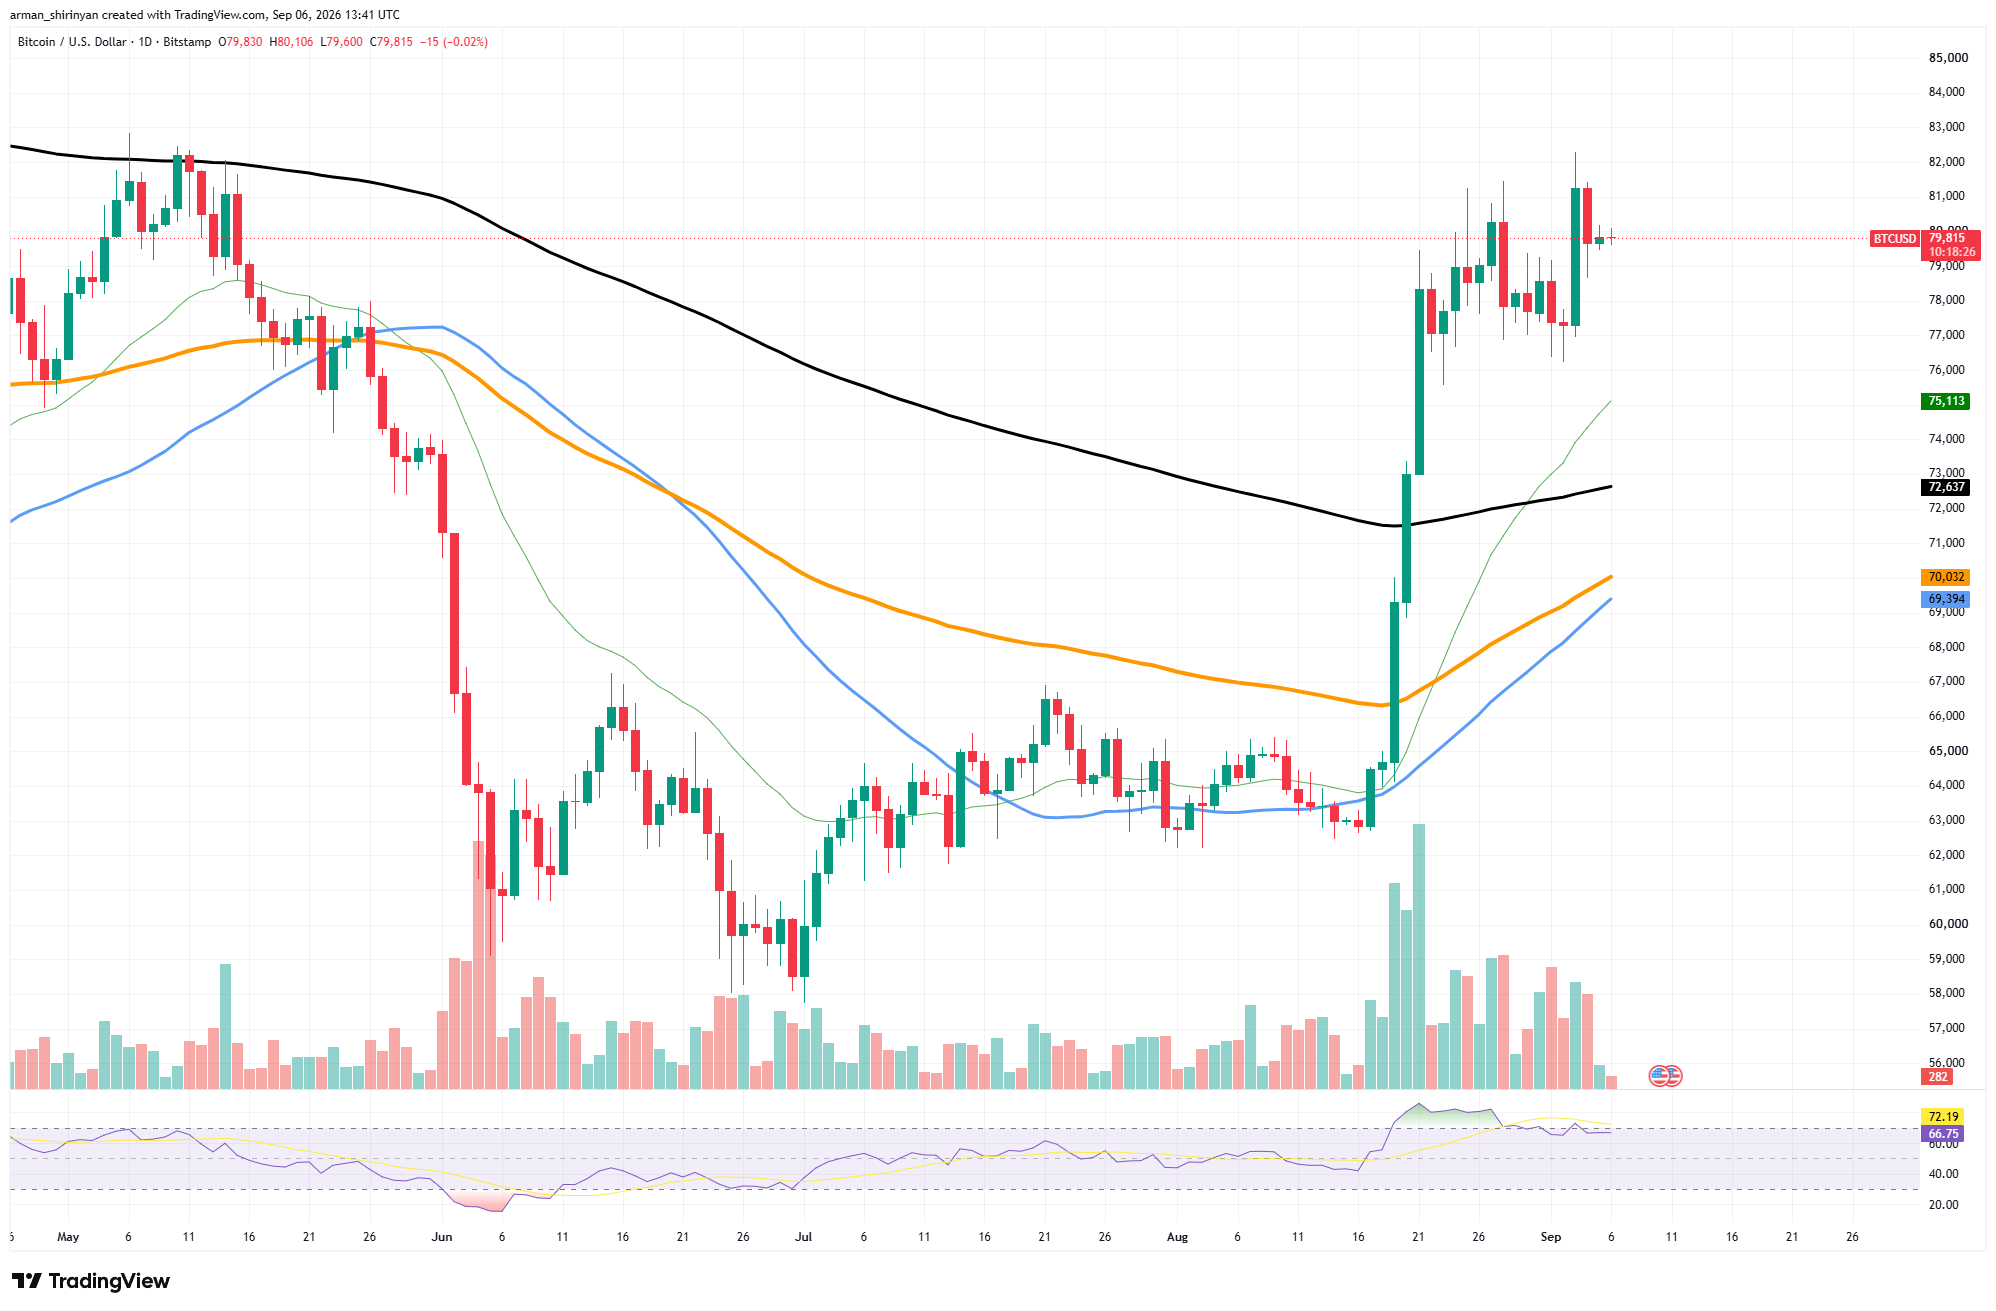
Additionally, Bitcoin maintains a significant distance from its main moving averages. While the 200-day moving average is close to $72,638, the 20-day average has increased to about $75,124. Additional averages between $69,400 and $70,000 further support the overall improvement in market structure following the August breakout.

Momentum is still high. After previously entering overbought territory, the RSI is currently close to 67. Although another strong move toward $82,000 might quickly push momentum back into overheated conditions, this gives Bitcoin some additional room to grow.
The strongest indication that the rally is resuming would be a daily breakout above $82,000, which could open up the $84,000–$85,000 area. The first crucial level of defense on the downside remains $77,000.
 Dan Burgin
 U.Today Editorial Team
