
Omisego is an Ethereum-based application intended to facilitate instant, cross-border transaction across the blockchain network. Launched as an ERC-20 token several years ago it has been hindered not only by Ethereum’s slow development but by its own slow development.
In Omisego’s favor is the fact that peer-to-peer cross-border transfers across fiat and cryptocurrencies are a seriously large undertaking. The good news is the network developers have launched an Alpha-version for public testing which means they’re close to delivering on their promises.
The Alpha announcement was delivered to the market via a blog post today which means it could drive an already bullish token higher. The Omisego native token is OMG. The OMG/USD has been advancing strongly over the past few weeks along with the broader cryptocurrency market. The token is up nearly 150% from its recent low and looking bullish after forming a nice rounded bottom.
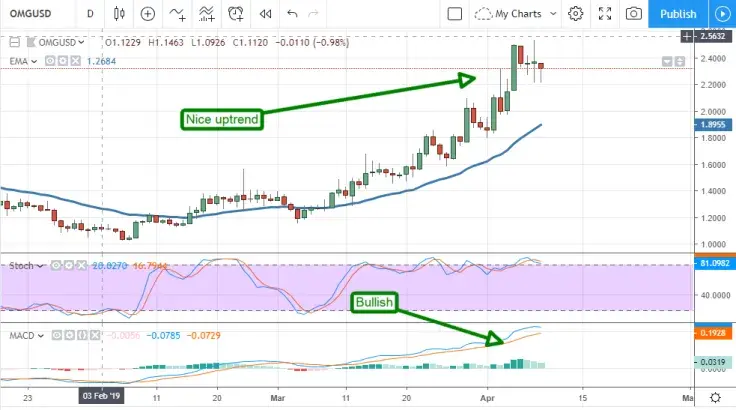
This 2019 rally is, so far, the result of generally bullish activity in the cryptomarket, possibly in anticipation of today’s news, and set up to continue higher. The most recent price peak is setting multi month high with convergent momentum and upwardly moving stochastic. This combination is a strong signal of rising prices and a continuation of the uptrend.
Support is near $2.25 and may be tested some more. When prices begin to move higher the first target for resistance is at $2.50. A move above $2.50 would be very bullish and could take OMG/USD up to $3.50 in the next 30 to 45 days.
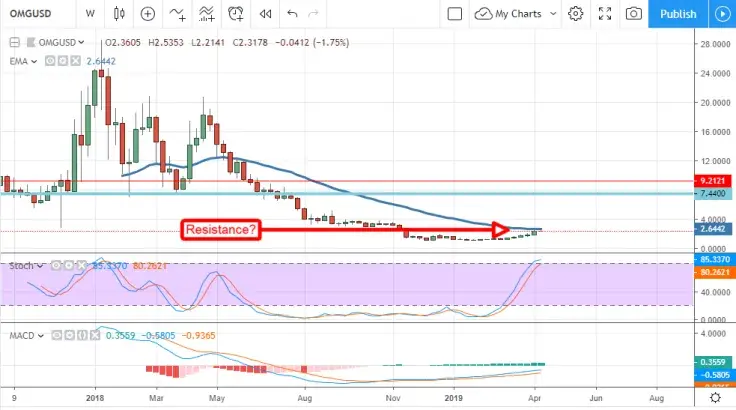
Omisego Long-Term Price Prediction
The weekly charts are bullish but rising prices are not guaranteed. Both MACD and stochastic are rising but the one is near overbought and the other is quite weak. Add to this the long-term 150-day exponential moving average is acting as resistance and a chance of correction emerges. If prices are able to move above the 150-day EMA we could see a full reversal in prices and march to retest $7.50 over the next few months.
Omisego chart by TradingView
 Dan Burgin
 U.Today Editorial Team