
Disclaimer: The opinions expressed by our writers are their own and do not represent the views of U.Today. The financial and market information provided on U.Today is intended for informational purposes only. U.Today is not liable for any financial losses incurred while trading cryptocurrencies. Conduct your own research by contacting financial experts before making any investment decisions. We believe that all content is accurate as of the date of publication, but certain offers mentioned may no longer be available.
The midweek landscape on the crypto market opens with a combination of chart disruptions, silent accumulation and a crucial Bollinger Bands signal forming on Bitcoin’s monthly chart. The most attention remains on the earnings report from $4.41 trillion tech giant Nvidia, which is now considered a prime benchmark for risk appetite across all the financial markets.
TL;DR
- XRP printed an abnormal jump to $90 on Kraken, a 3,600% deviation from its $2.17 price, followed by a 98% retrace.
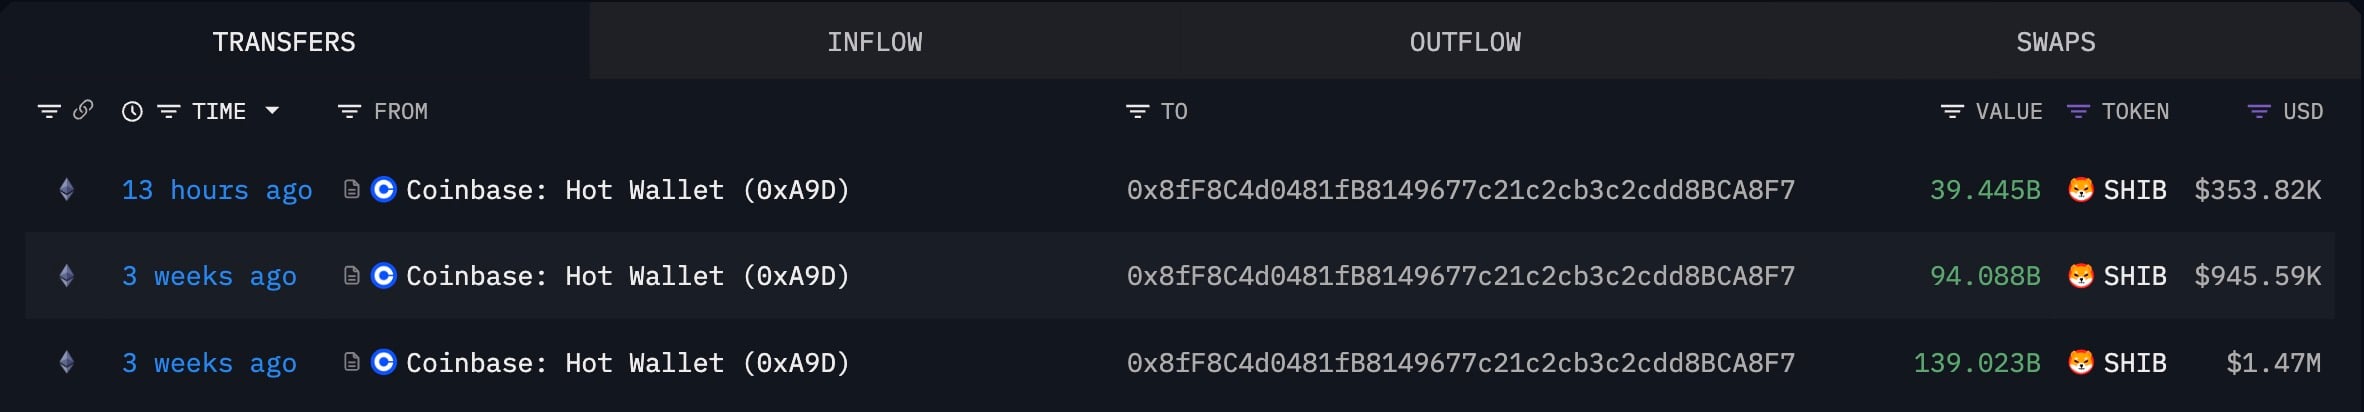
- Someone withdrew 272,556,924,649 SHIB from Coinbase, absorbing $2.38 million in the Shiba Inu meme coin.
- Despite the FUD, Bitcoin trades at $91,360, with the monthly midband sitting at $87,600, keeping the structure firmly bullish.
XRP hits $90 on Kraken in abnormal 3,600% price spike
The XRP chart printed the most chaotic moment of the week when the Kraken feed threw a vertical candle to $90 before snapping back to the $2.13 zone almost immediately, as per TradingView. Just seconds earlier, XRP sat at $2.17, so the swing represented a more than 3,600% deviation on a major U.S. exchange, where moves like that do not occur under normal market conditions.

The glitch did not happen only on the upside. Right before the spike, the same pair briefly showed a wick to $0.00272, a near-total collapse for a fraction of a second. Two opposite extremes landing in the same short window remove any doubt: this was a system fault, not real trading.
Whether it came from an order book gap, delayed matching engine layers, or a desync between the interface and execution routes, the outcome was the same — a price that nobody in the market could capture.
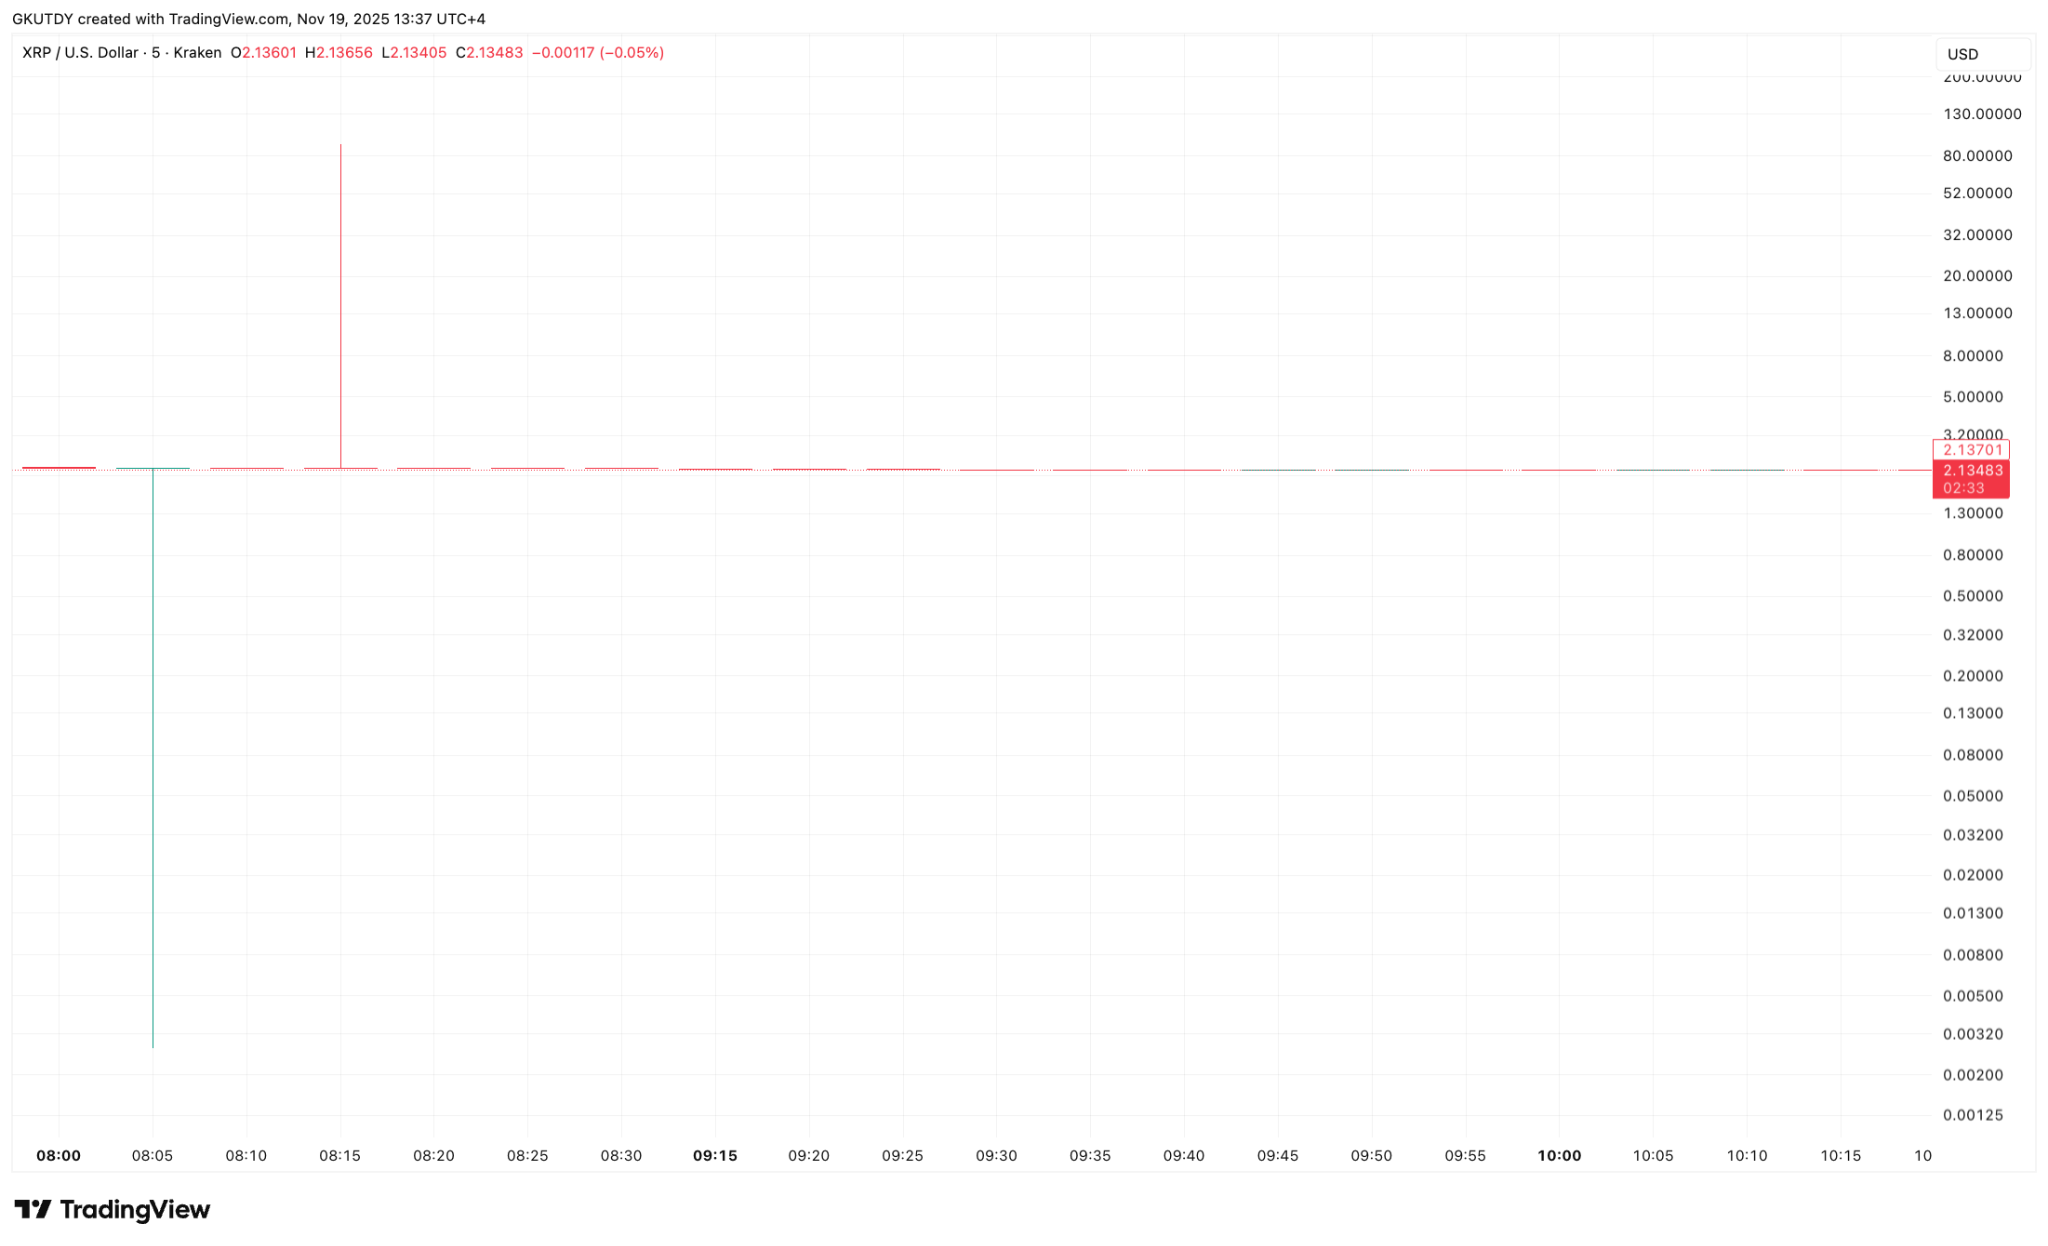
This pattern is familiar to XRP’s U.S. venue history. Similar one-off prints appeared on Gemini when liquidity thinned or execution stalled, generating isolated candles that never reflected the actual market. The broader XRP price across major exchanges stayed in its usual $2-range corridor during the entire episode, confirming it was not a repricing event.
272,556,924,649 SHIB leave Coinbase into unknown
While XRP printed a chart anomaly, SHIB delivered a real on-chain read. A new wallet pulled 272,556,924,649 SHIB from Coinbase — a $2.38 million move at the moment of transfer. Arkham data shows the address holding only two assets, SHIB and a small BASED balance, with SHIB making up almost the entire $2.38 million stack.
All inflows over the last three weeks trace back to Coinbase hot wallets, broken into three structured deposits that add up to the full 272.5 billion coins.
The latest seven-day chain flow data shows SHIB's net exchange flow changing direction, going from a few days of negative to a strong positive and then back into negative again. This kind of pattern often happens when money is withdrawn in stages and the market adjusts later.
Price action confirms the disconnect. SHIB is trading near $0.00000871 and is holding a clean weekly downtrend, with zero reaction to the large pull. Meme assets do not usually respond straight away to whale movements. On-chain signals show up early, and spot liquidity only catches up when conditions change weeks later.
Bitcoin’s bull run deadline revealed by Bollinger Bands
The monthly Bollinger Bands on Bitcoin have opened a clear structural gap, as per TradingView. The midband is at $87,600 on the current candle, while spot trades are near $91,360. Even after dropping 27% from its early October highs above $125,000, Bitcoin has not breached the support level, maintaining the overall structure.
The midband on the monthly chart is the line that shows if an uptrend keeps going. As long as the price closes above it, the market is still considered bullish, even during big dips. This month's drop into the $89,000-$91,000 range did not break that rule.
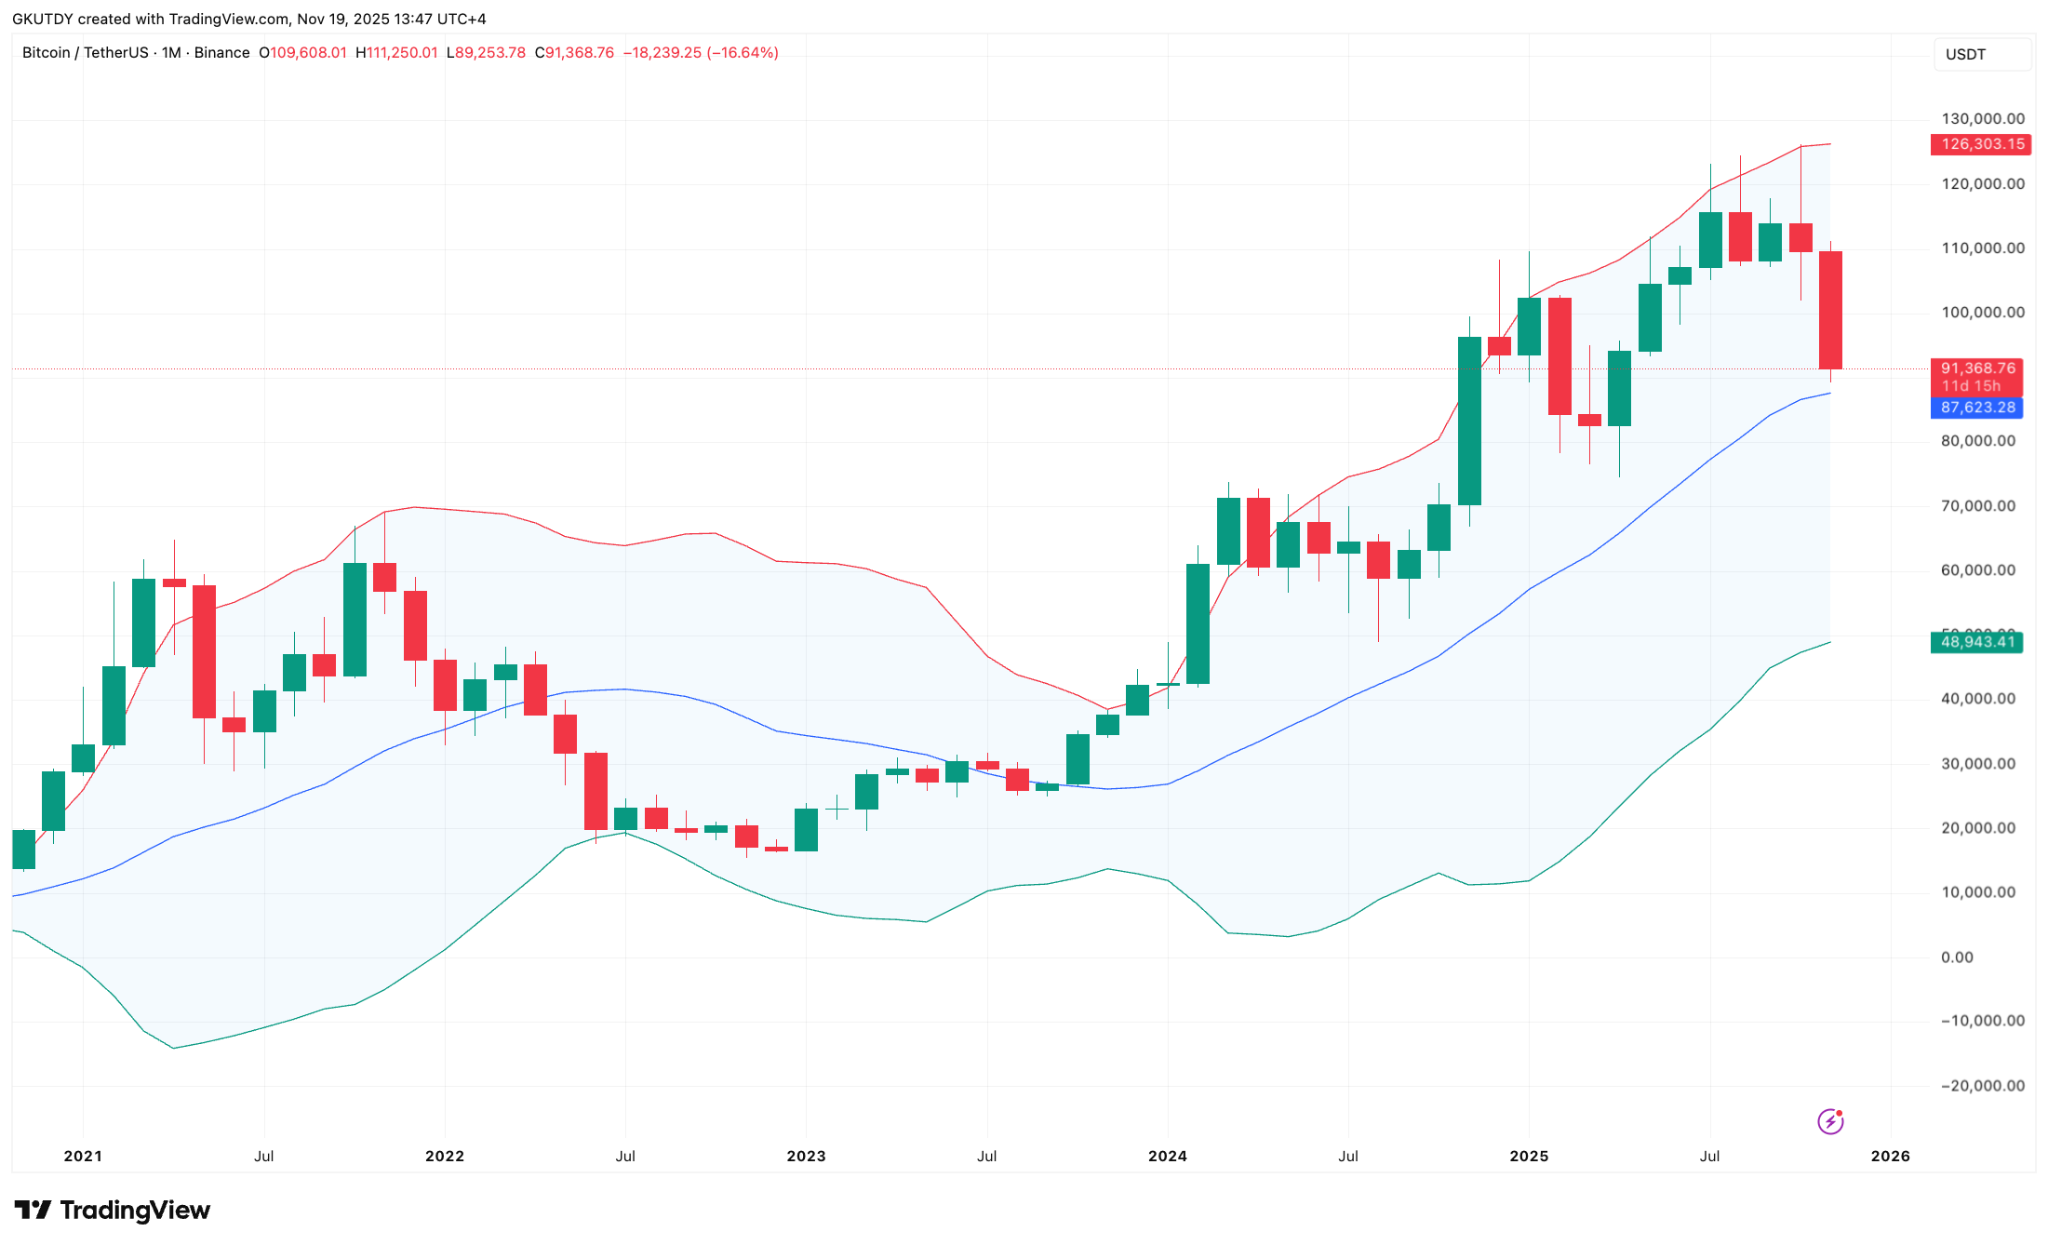
With 11 days left, Bitcoin would need to close under $87,600 to keep the market stable. So far, there has been no indication of that. ETFs keep on taking in supply, and liquidity is still all over the place, but it is there, and long-term holders have not unwound any major positions.
The move from $125,000 into the low $90,000s is just a shift in volatility inside the upper half of the monthly bands, not a major reversal. As long as the midband holds on a closing basis, Bitcoin keeps its bullish frame despite some short-term turbulence.
Crypto market outlook
The next stretch of sessions will turn on Bitcoin’s monthly structure holding above $87,600, on whether altcoin liquidity stabilizes after this week’s distortions and on Nvidia’s $4.41 trillion earnings reaction setting the tone for the risk cycle ahead.
- Bitcoin (BTC): Trades above the $87,600 monthly midband at $91,360, maintaining the bullish structural trend.
- XRP: Underlying price stable near $2.13 despite glitch-driven anomalies on Kraken.
- Shiba Inu (SHIB): Price muted despite a 272.5 billion outflow from Coinbase, suggesting accumulation under weak retail sentiment.

 Dan Burgin
 U.Today Editorial Team