
Litecoin continues growing through the clear downtrend, and $100 doesn’t seem to be a bottom. What to expect from LTC in the nearest days? How to trade it wisely? Read Litecoin price predictions from TradingView users and check their price charts to understand what’s pushing LTC price down.
H&S pattern completed: Will it trigger the failure?
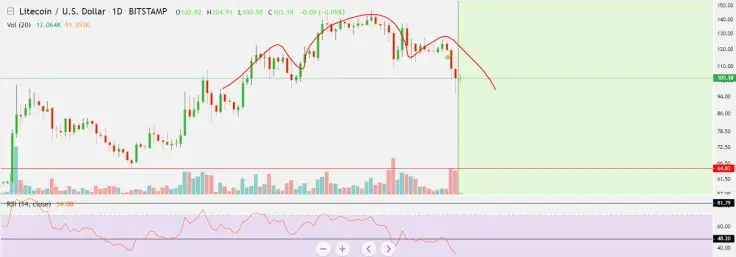
Look at this LTC price chart: Litecoin has completed a head-and-shoulders pattern, which is actually a bad sign that might indicate the double bottom approaching. The user claims Litecoin can hit the $64 level, and it seems to be more than possible now when a downtrend is going on and on.

It’s not all lost for LTC/BTC
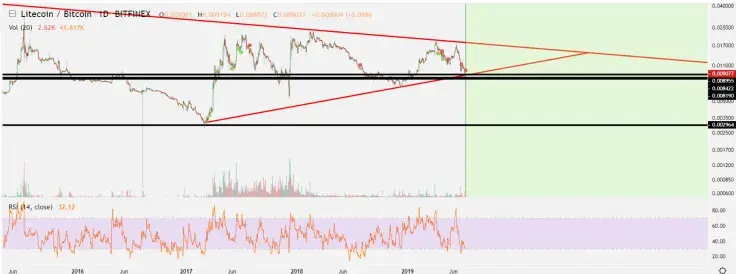
The same user has quite an interesting outlook at LTC/BTC trading pair: it doesn’t seem to be so hopeless. Litecoin/Bitcoin has obviously bottomed, but it is still within the long-term triangle.
User’s previous BTC price analysis shows that Bitcoin is ready for a correction of 30-40%, which is perfectly timed with LTC/BTC ratio having bottomed out on all timeframes, being heavily oversold on all timeframes, and with major good news coming from the LTC: Halving, supply cut; Confidential transactions; Litecoin Foundation partnership with world-class sports club to increase adoption, and LTC being incorporated within existing payment processors that have a global and/or major regional reach.
Thus, if LTC/BTC manages to break 0.016, it will definitely go to 0.025, and possibly wick to 0.035.
It means you shouldn’t lose your last chance to get in Litecoin. All those who jumped LTC for BTC are about to get rejected twice; BTC will crash 30-40%, and when they realize the Litecoin Halving Pump has not yet happened, LTC ratio will already have pumped.
Opponents’ opinion
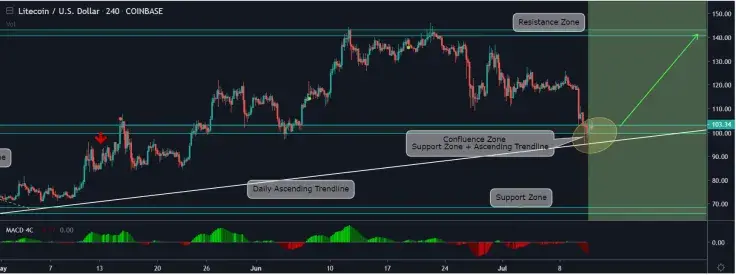
While in the last week, when the downside move was starting, many traders saw the potential target for Litecoin was $100. Effectively, it was reached, and now price is on a confluence zone between the support zone and the ascending trendline. As this is a strong level, a new bullish impulse can start here, towards the previous maximum level at 140 on average.
However, some confirmation is needed before taking positions, since the trend at this moment remains bearish.

LTC/USD enters the hibernation period
Litecoin / USD Short-term price analysis
Litecoin has a bearish short-term trading outlook: the LTC / USD pair appearing increasingly weak below its 200-period moving average on the four-hour time frame.
The 4HR frame is showing that the recent decline in the cryptocurrency has helped to create a large head and shoulders pattern, with the LTC / USD pair hovering around neckline support.
Technical indicators on the 4HR time frame are bearish and continue to provide a strong sell signal.
According to CryptoBriefingTA, the bearish head and shoulders pattern on the four-hour time frame has a downside projection of around $40.00. What about other indexes on the 4HR chart?
-
The Relative Strength indicator on the four-hour time frame is bearish and is now trading in oversold territory.
-
The MACD indicator is bearish on the four-hour time frame and continues to generate a clear sell signal.
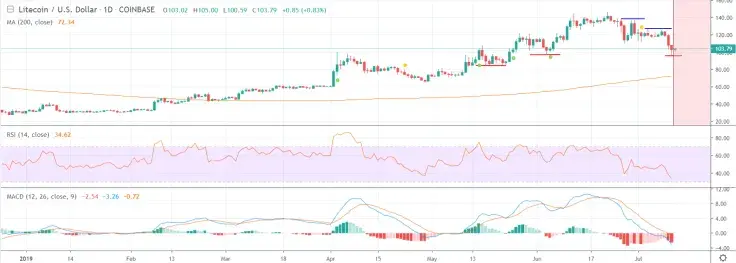
As for, LTC/USD medium-term price analysis, Litecoin has a bullish medium-term trading bias, with the cryptocurrency still trading well above its trend-defining 200-period moving average.
The daily time frame shows that a technical shift has now occurred, with the cryptocurrency now creating bearish lower highs and lower lows. Key technical support for the LTC/USD pair is currently found at the $100.00 and $84.00 levels.
Technical indicators are turning lower and continue to issue a bearish trading signal on the daily time frame. If we analyze LTC/USD daily chart by TradingView, a bearish triple-top pattern formation is also in play on the daily time frame:
-
The Relative Strength indicator on the daily time frame is turning lower and continues to generate a bearish trading signal.
-
The MACD indicator is bearish on the daily time frame, with both the MACD signal line and histogram issuing a sell signal.
Litecoin price charts by TradingView
 Dan Burgin