Once again, Ethereum and Ripple switched places in CoinMarketCap rankings, with the latter moving to number 2 spot. The difference in market cap is very slim, both digital assets standing at $14 billion, so another flippening is not out of the question.
We warned several days ago about a potential pullback on ETH/USD, but the speed of the current drop makes us wonder if we are dealing with a retracement to the short-term uptrend that started on the Dec. 15 last year or a resumption of the long-term downtrend of 2018.
Chart Analysis – ETH/USD
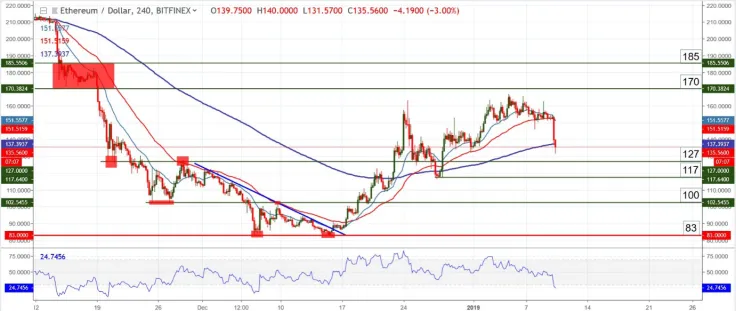
Having dropped almost 12% in the last 24 hours, Ethereum is now trading at 134 against the US Dollar and has reached a major turning point represented by the 200-period Exponential Moving Average on a 4-hour chart.

True downtrend resumption will only occur when the low at $83 is breached, but until then a break of the 200 EMA could mean a major blow dealt to the bulls and one that would suggest a further drop. If the said barrier is broken, the next destination will be 127 and the trough at 117. The RSI has just entered oversold on a 4-hour chart, thus slightly increasing the chances of a move up.
Support zone: 127 and 117 (unclear how price behaves at 200 EMA)
Resistance zone: 50 EMA (red line) followed by 165 - 170
Most likely scenario: a touch of 127, possibly 117
Alternate scenario: recovery and move up based on the oversold position of the RSI
 Vladislav Sopov
 Dan Burgin