
Disclaimer: The opinions expressed by our writers are their own and do not represent the views of U.Today. The financial and market information provided on U.Today is intended for informational purposes only. U.Today is not liable for any financial losses incurred while trading cryptocurrencies. Conduct your own research by contacting financial experts before making any investment decisions. We believe that all content is accurate as of the date of publication, but certain offers mentioned may no longer be available.
Some coins have returned to the green zone, according to CoinStats.
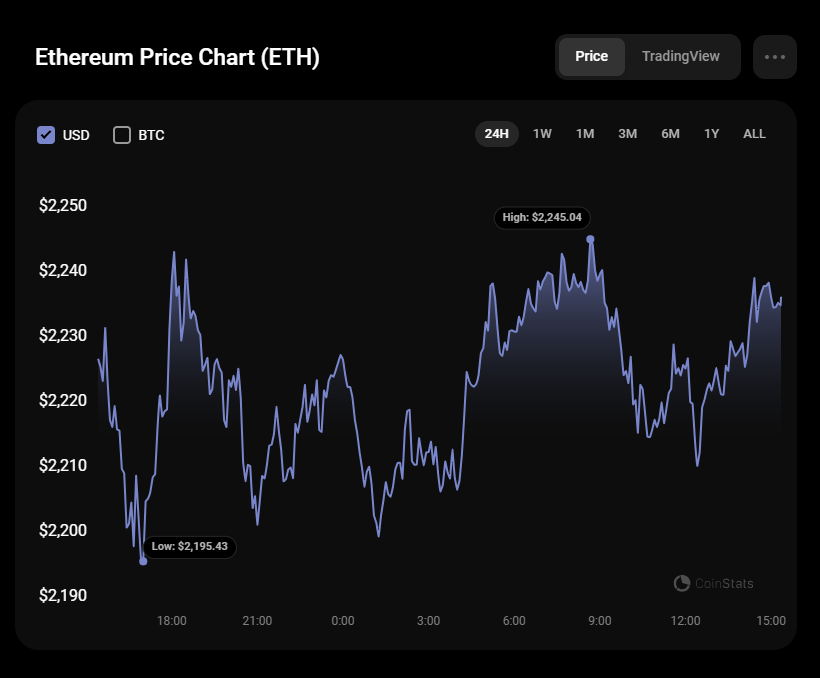
ETH/USD
The rate of Ethereum (ETH) has increased by 0.24% since yesterday.
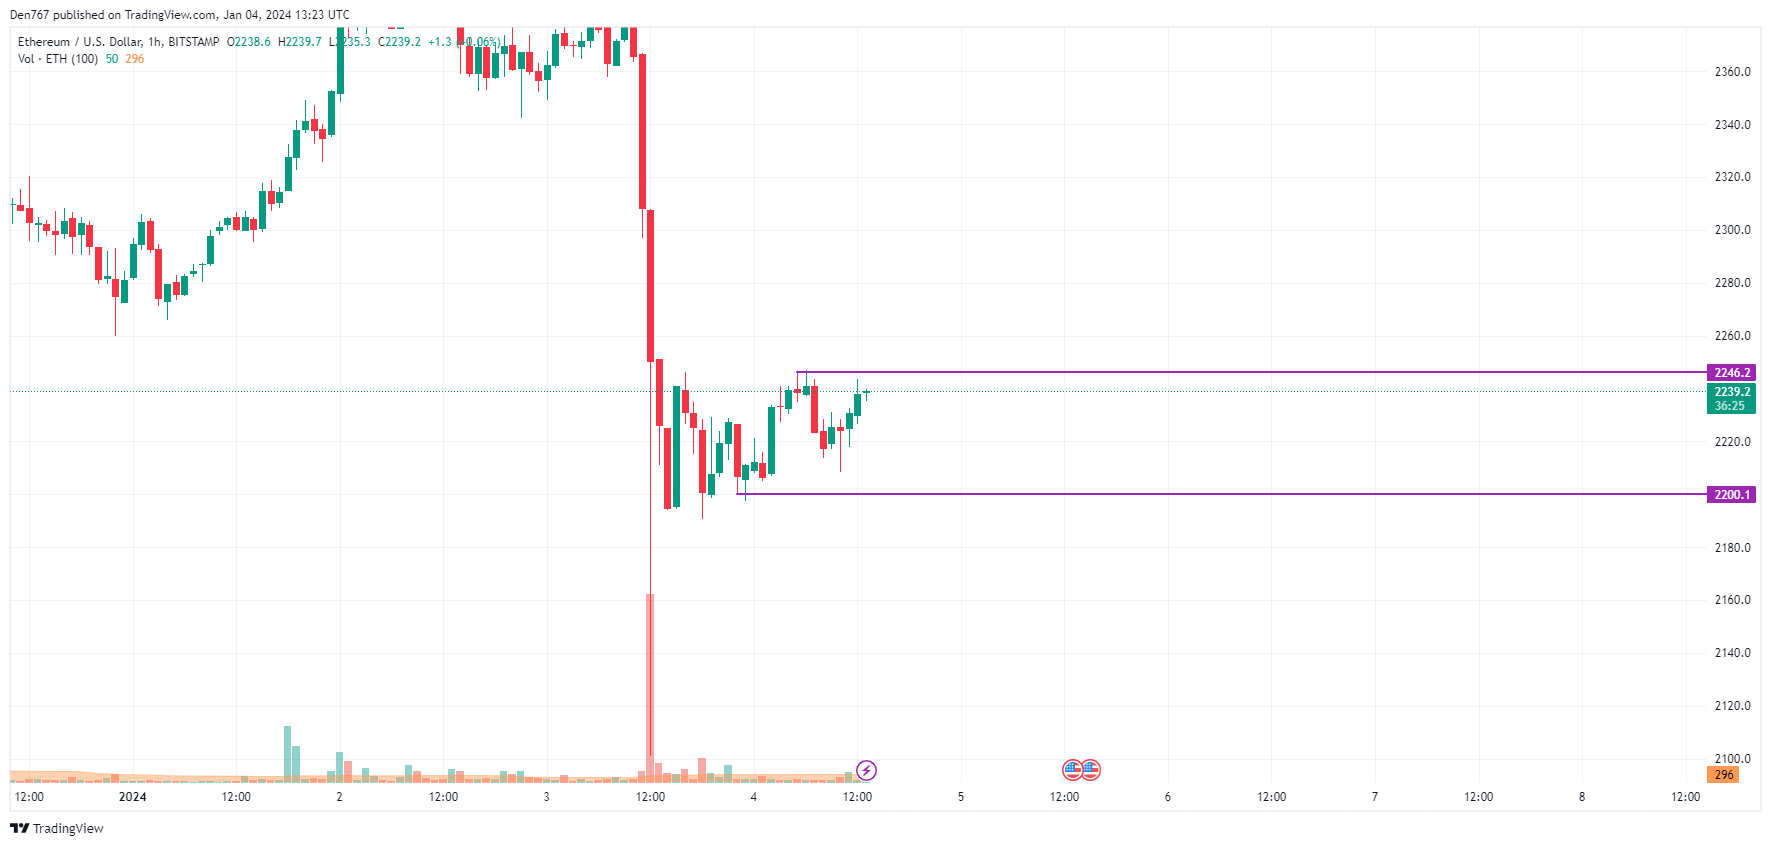
On the hourly chart, the price of ETH is looking bullish as it is on the way to test the resistance of $2,246. If the daily bar closes near it or even above, the accumulated energy might be enough for a breakout followed by a move to the $2,280-$2,300 zone.
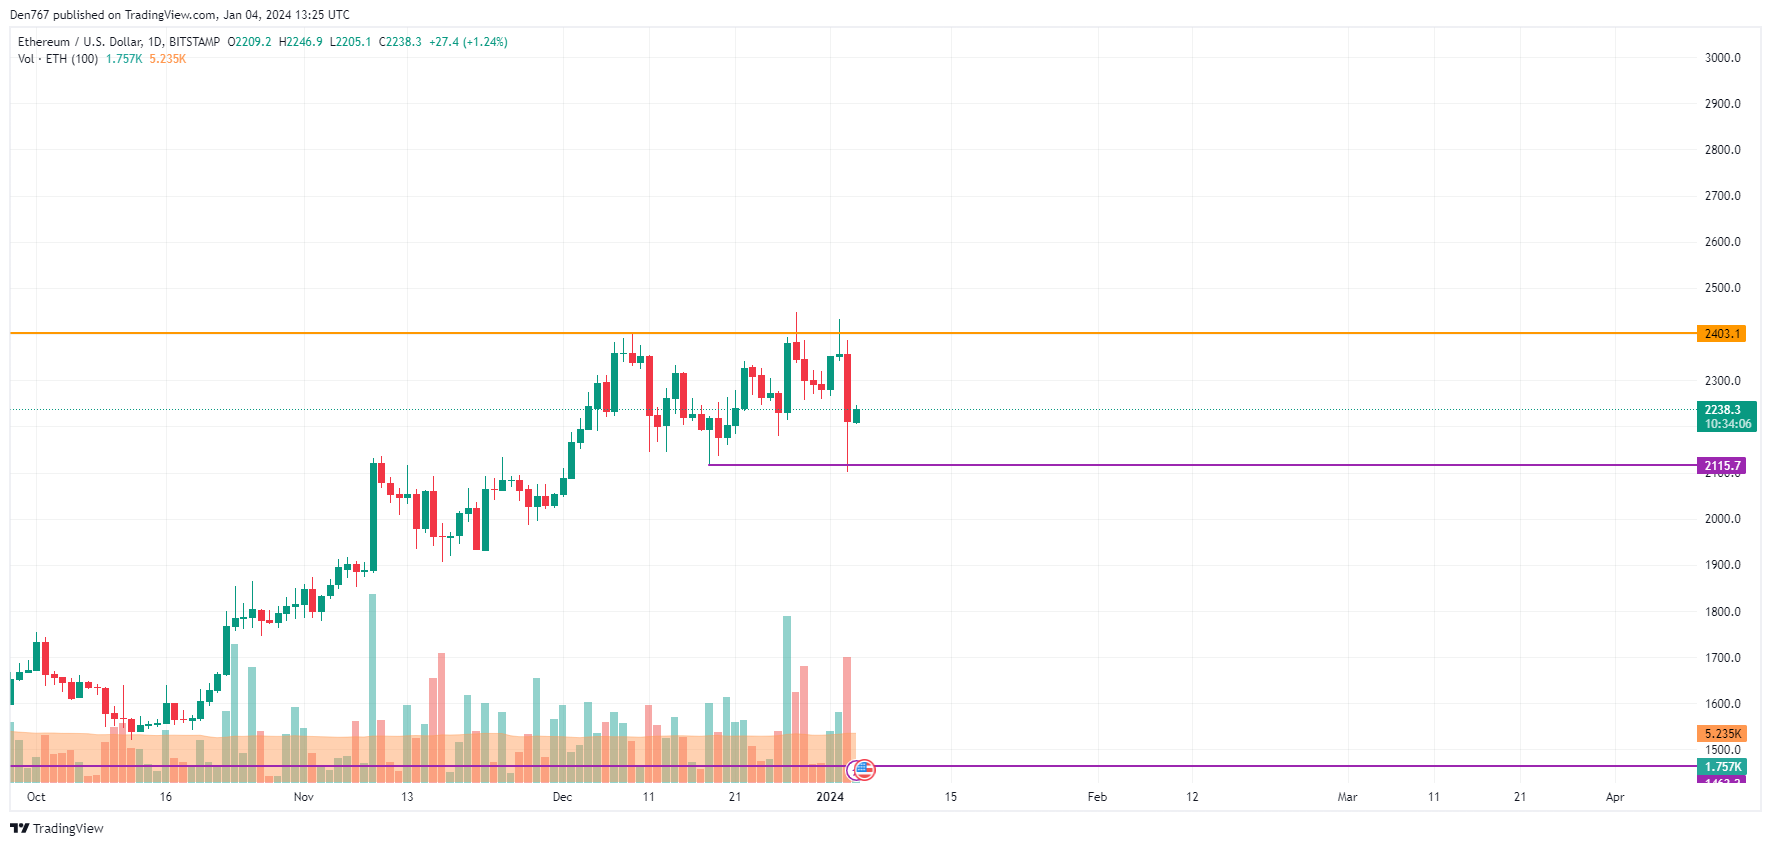
A less positive situation is on the bigger time frame. The rate is in the middle of the wide channel, which means that neither buyers nor sellers are dominating.

In this case, sideways trading between $2,200 and $2,300 is the more likely scenario.
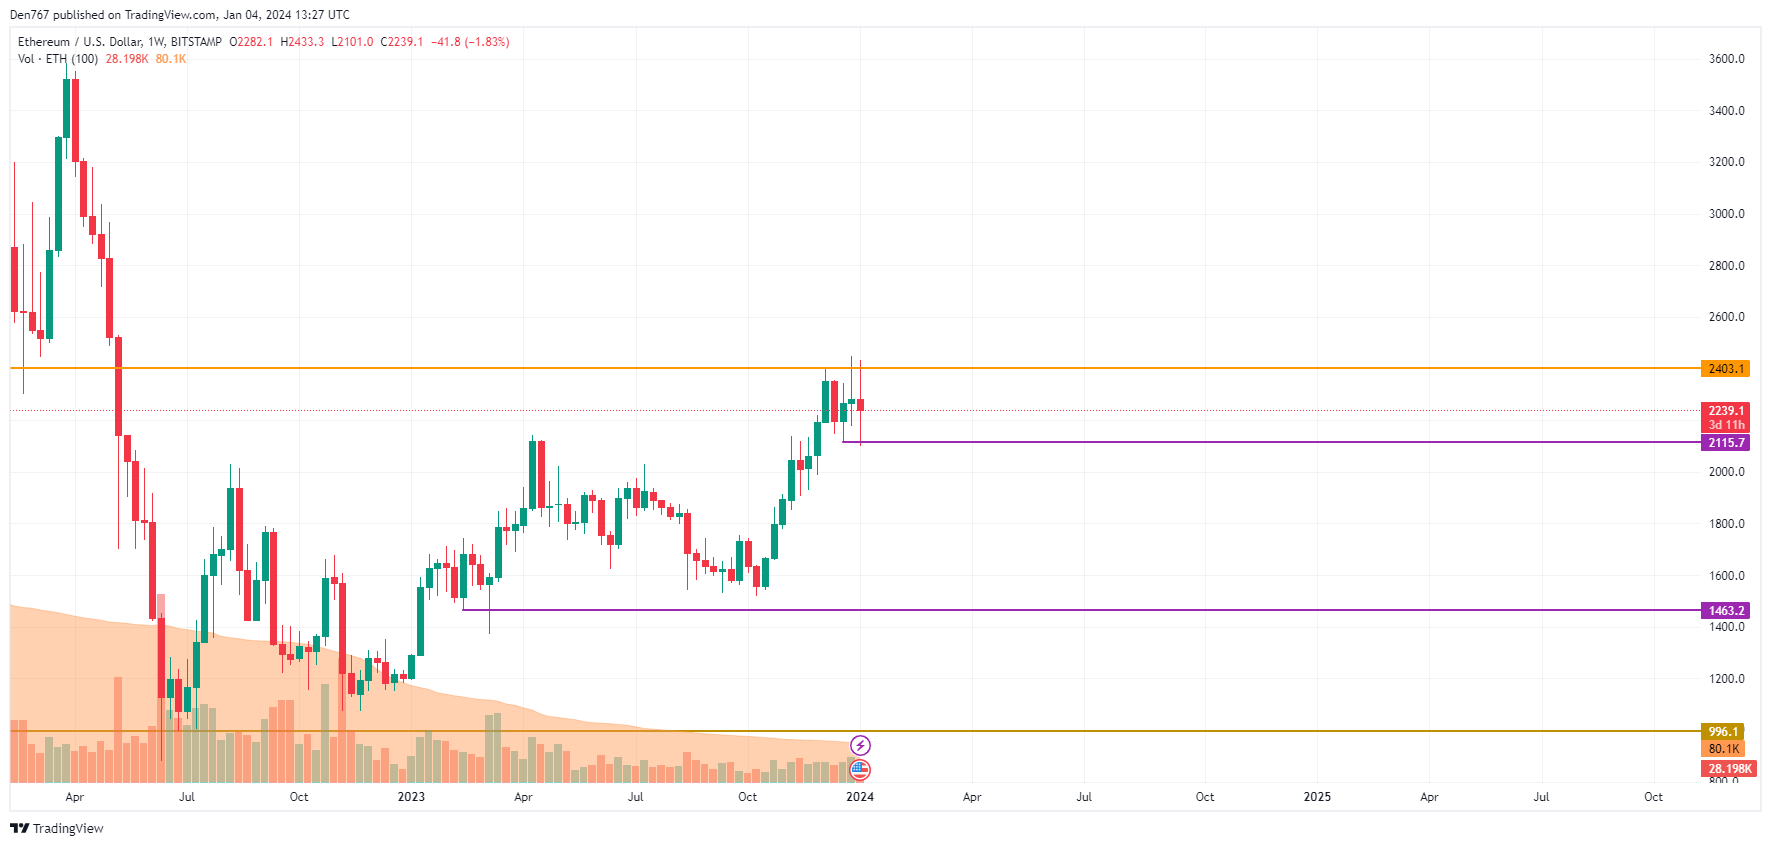
On the weekly chart, the picture is similar. If the candle closes around the current prices, traders are likely to expect a consolidation around the $2,200 zone next week.
Ethereum is trading at $2,238 at press time.
 Dan Burgin
 U.Today Editorial Team