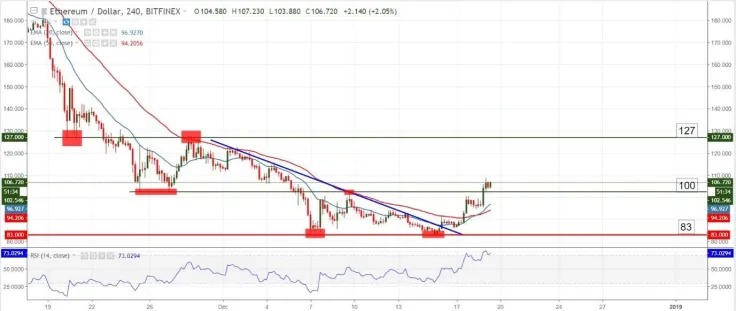
A couple of days ago, we spoke about a double bottom formed on ETH/USD charts, which is a strong bullish formation, and we predicted a jump higher. This scenario came true, and now Ethereum is trading at $106, comfortably above the major hurdle at $100.
Keep in mind that despite the major upside movement seen across the board over the last few days, we are not yet dealing with a bull market from a longer-term perspective. The entire 2018 has been bearish, and this cannot be erased by a few days of bullish action. Seeing green on the charts is great, but don’t go “all in” just yet.
Chart Analysis – ETH/USD

With gains of almost 12% in the last 24 hours and more than 15% for the last 7 days, Ethereum seems to be at the beginning of a stronger recovery. Similar to other cryptocurrency pairs, ETH/USD shows an overbought Relative Strength Index, which is an early warning that a retracement lower will soon follow.
As long as this potential retracement doesn’t break any of the two Exponential Moving Averages, the bias remains bullish, anticipating a move into the next resistances (110 and 120 as psychological levels followed by the technical level at 127). If the pair remains above 100, it will greatly increase the chances of an extended bullish move.
Support zone: 95 – 100 and the two EMAs
Resistance zone: 110, 120 and 127
Most likely scenario: upside price action takes a “breather” (sideways or shallow retracements) and then continues into the next resistances
Alternative scenario: drop into the 50 EMA (red line)
 Dan Burgin
 Godfrey Benjamin
 Caroline Amosun
 Tomiwabold Olajide