Disclaimer: The opinions expressed by our writers are their own and do not represent the views of U.Today. The financial and market information provided on U.Today is intended for informational purposes only. U.Today is not liable for any financial losses incurred while trading cryptocurrencies. Conduct your own research by contacting financial experts before making any investment decisions. We believe that all content is accurate as of the date of publication, but certain offers mentioned may no longer be available.
In the weekly timeframe, Dogecoin (DOGE) has formed a technical signal pointing to a potential upside of around 27%. According to the latest DOGE/USDT chart data from TradingView, the price has successfully secured a position above the middle line of the Bollinger Bands indicator, represented by the 20-week moving average, effectively turning the upper boundary of the channel into a price magnet.
Additional depth to this pattern comes from moderate but consistent support from institutional capital.
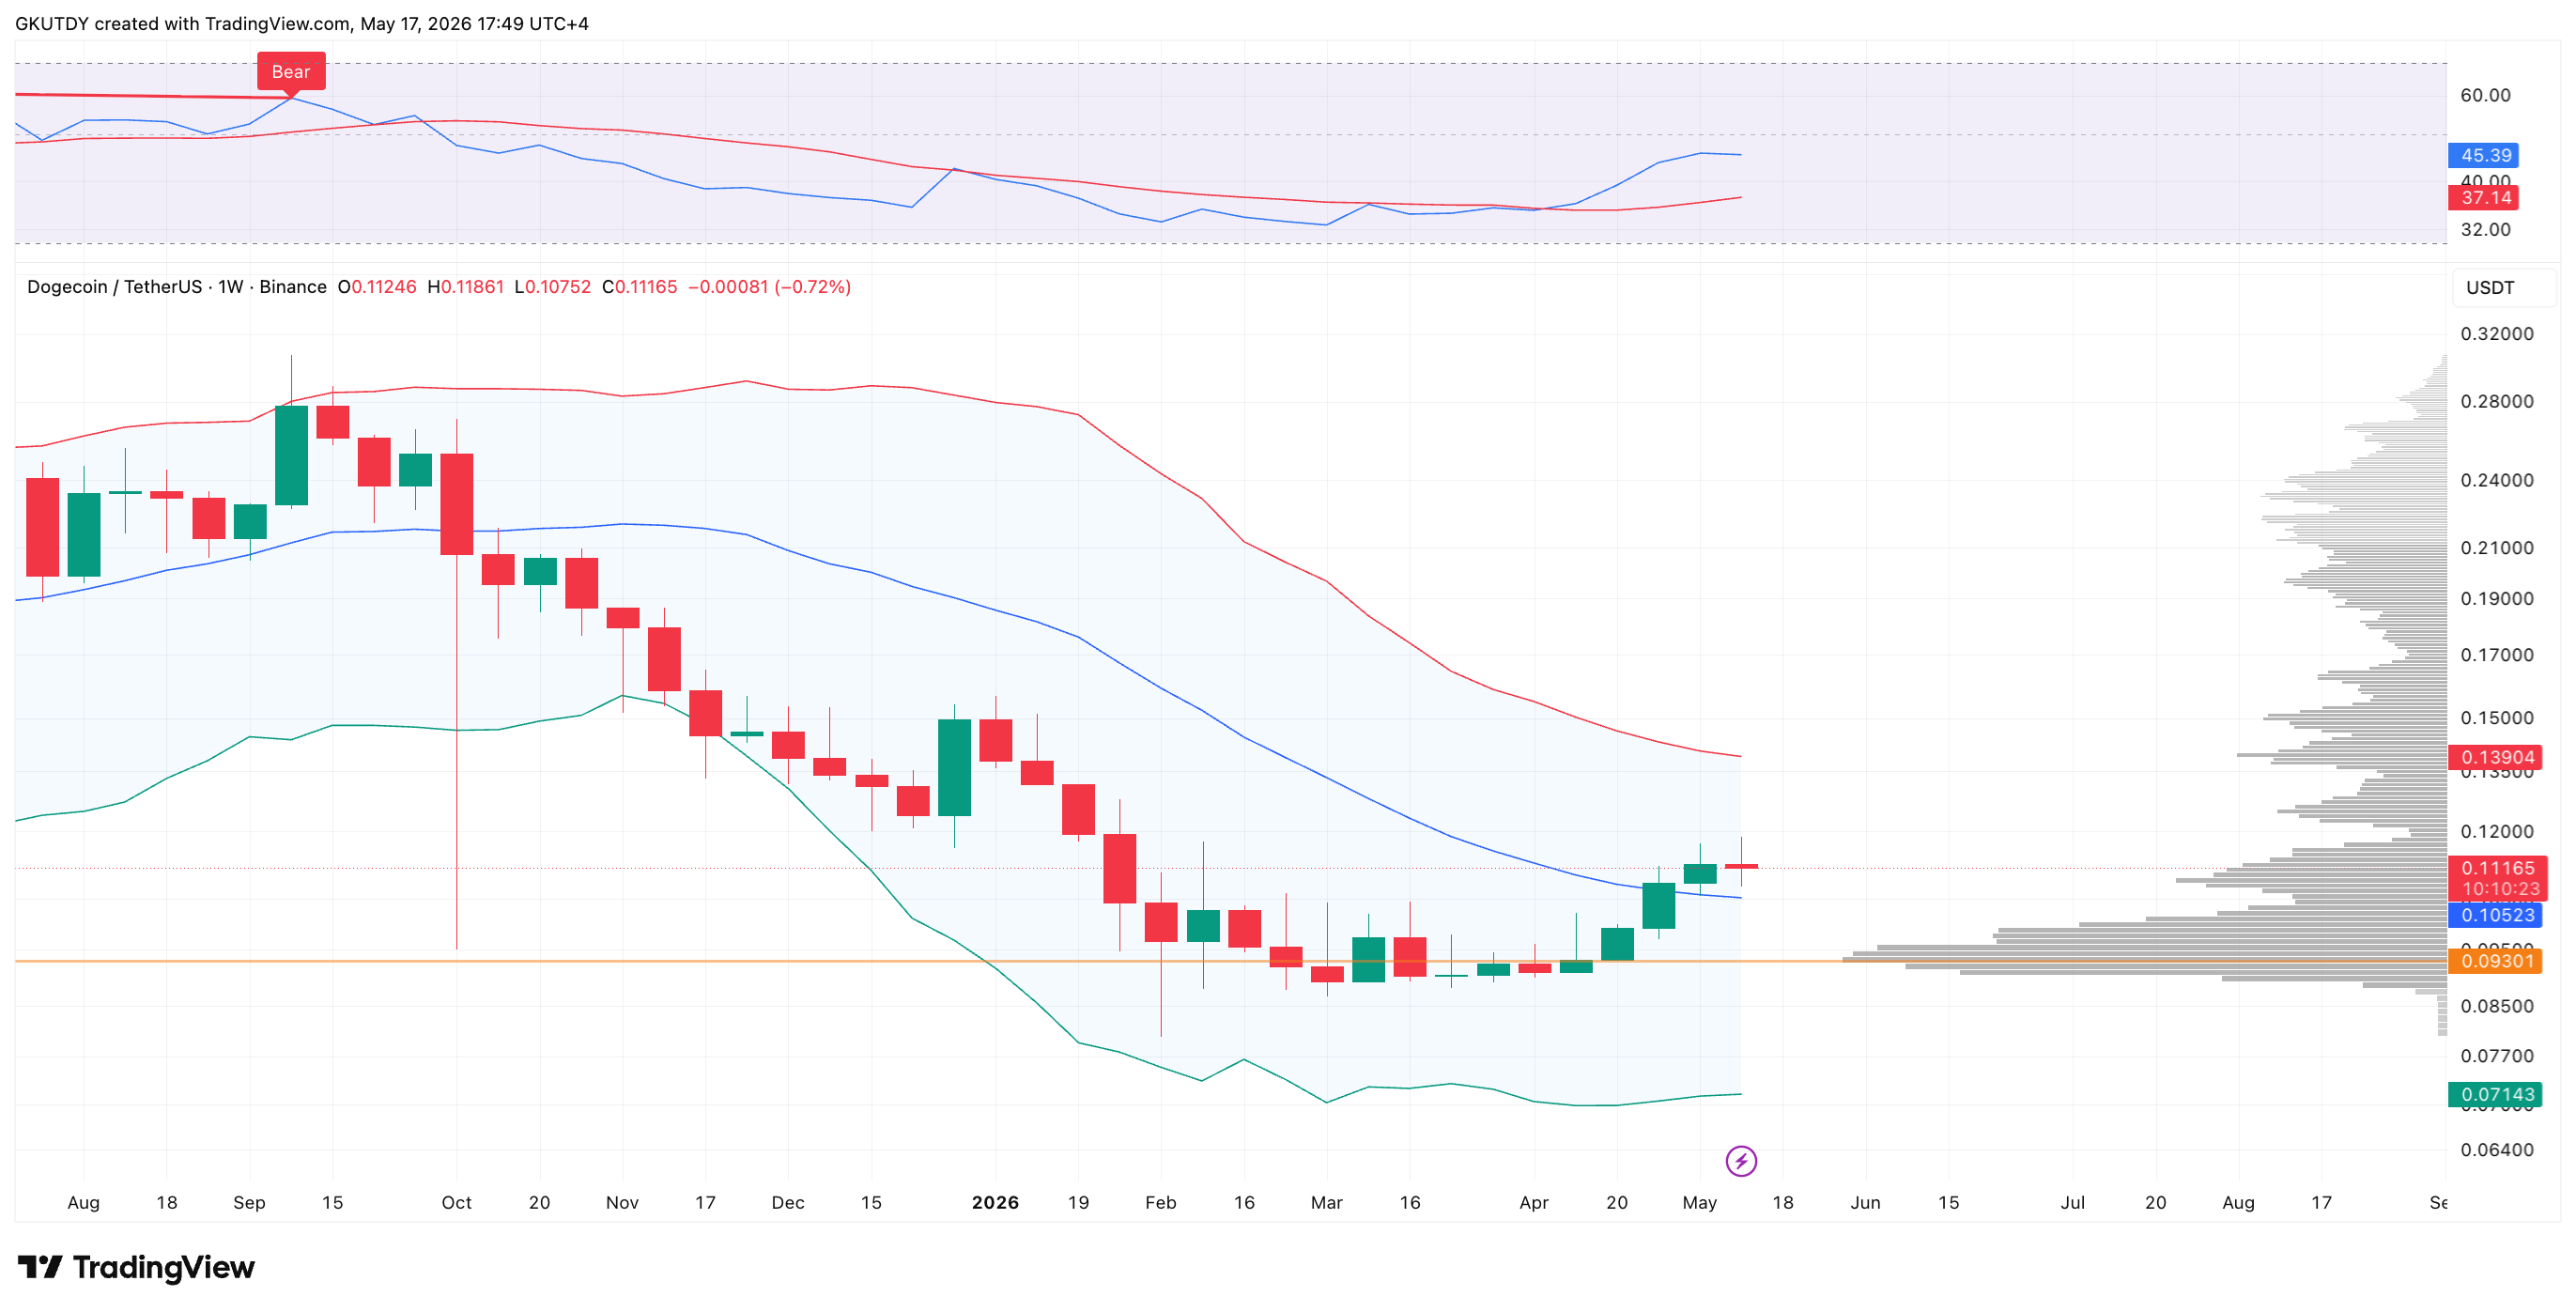
The main technical outcome of the week is Dogecoin holding above the $0.11126 level - a key middle Bollinger Band line, which is currently located at $0.10522. In the context of the indicator on a higher timeframe, such consolidation changes the market structure - momentum transitions to the bulls after a prolonged consolidation phase, while the upper red boundary of the indicator starts acting as the primary directional target.
Why Dogecoin's chart by Bollinger Bands puts 27% upside in play
The setup mathematically breaks down as follows: the current Dogecoin price at $0.11126 is holding above the mid-band, the target remains the upper band at $0.13901, and movement toward the upper boundary opens a direct path to approximately 25%-27% upside. At the same time, the key long-term protection level for buyers remains the lower Bollinger Band, currently positioned at $0.07142.
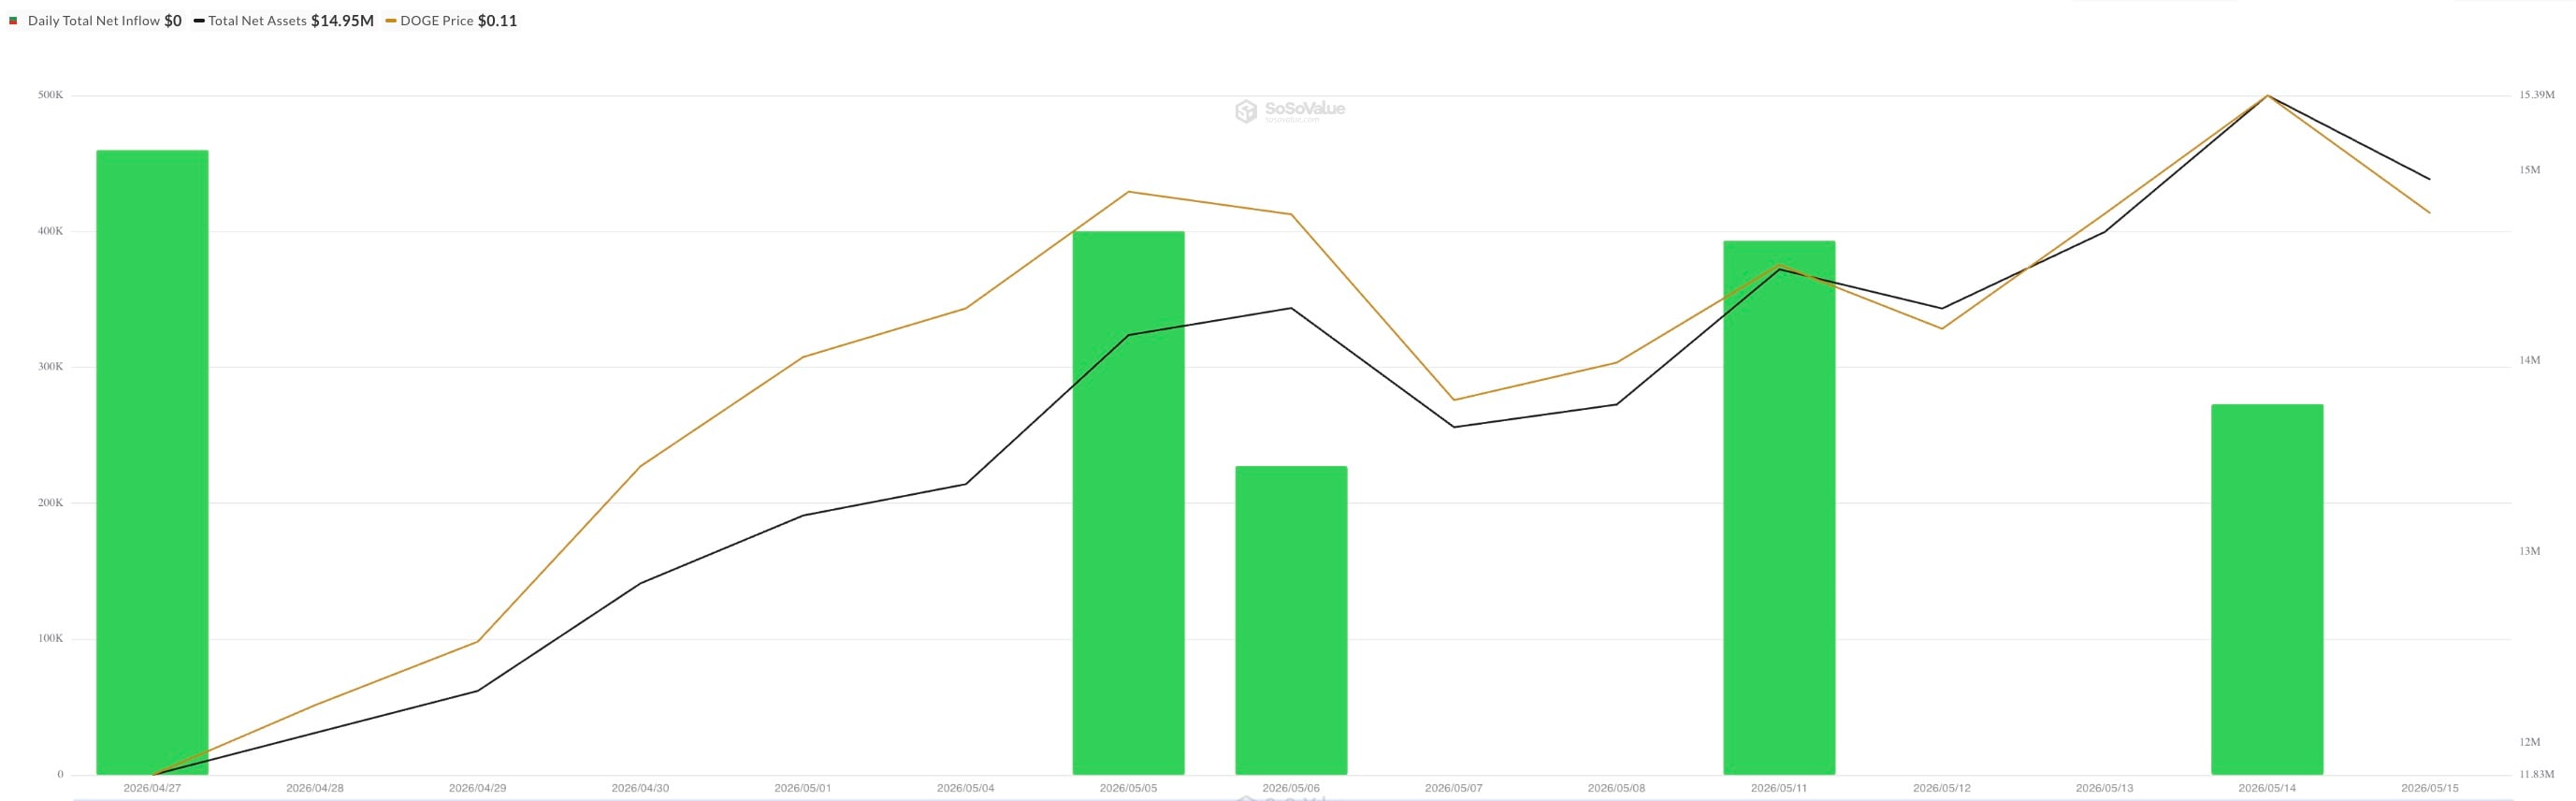
Supporting the technical picture are institutional flow data. According to the SoSoValue dashboard, spot DOGE ETFs such as GDOG from Grayscale Investments and TDOG from 21Shares have now recorded a third consecutive week of positive net inflows, totaling $1.753 million.

This consistent three-week inflow has pushed cumulative total net inflows to $10.92 million, while total net assets under management reached $14.95 million, with DOGE trading around $0.11126.
Although ETF volumes remain moderate and are not yet the market's primary driver, the fact that inflows have remained positive for three straight weeks reduces overall selling pressure. The technical target at $0.139 therefore appears justified, though for the full 27% upside scenario to materialize, bulls must critically defend the dynamic mid-band support at $0.105.
 Dan Burgin
 U.Today Editorial Team