
Disclaimer: The opinions expressed by our writers are their own and do not represent the views of U.Today. The financial and market information provided on U.Today is intended for informational purposes only. U.Today is not liable for any financial losses incurred while trading cryptocurrencies. Conduct your own research by contacting financial experts before making any investment decisions. We believe that all content is accurate as of the date of publication, but certain offers mentioned may no longer be available.
After weeks of continuous downside pressure, Shiba Inu made an unexpected breakout attempt that momentarily caught traders off guard. The asset abruptly moved higher and broke out of a short-term consolidation pattern after being trapped in a protracted bearish structure. Although the action has brought SHIB back into the spotlight, the overall state of the market indicates that the rally may still encounter strong opposition in the future.
SHIB is currently trading close to $0.0000060, which is a significant increase from its recent lows of $0.0000055-$0.0000057. The move was made after the token’s price compression had been increasing for a few days, forming a tight descending triangle on the chart. Buyers swiftly pushed the price higher after that pattern’s upper boundary was crossed, resulting in a brief breakout.
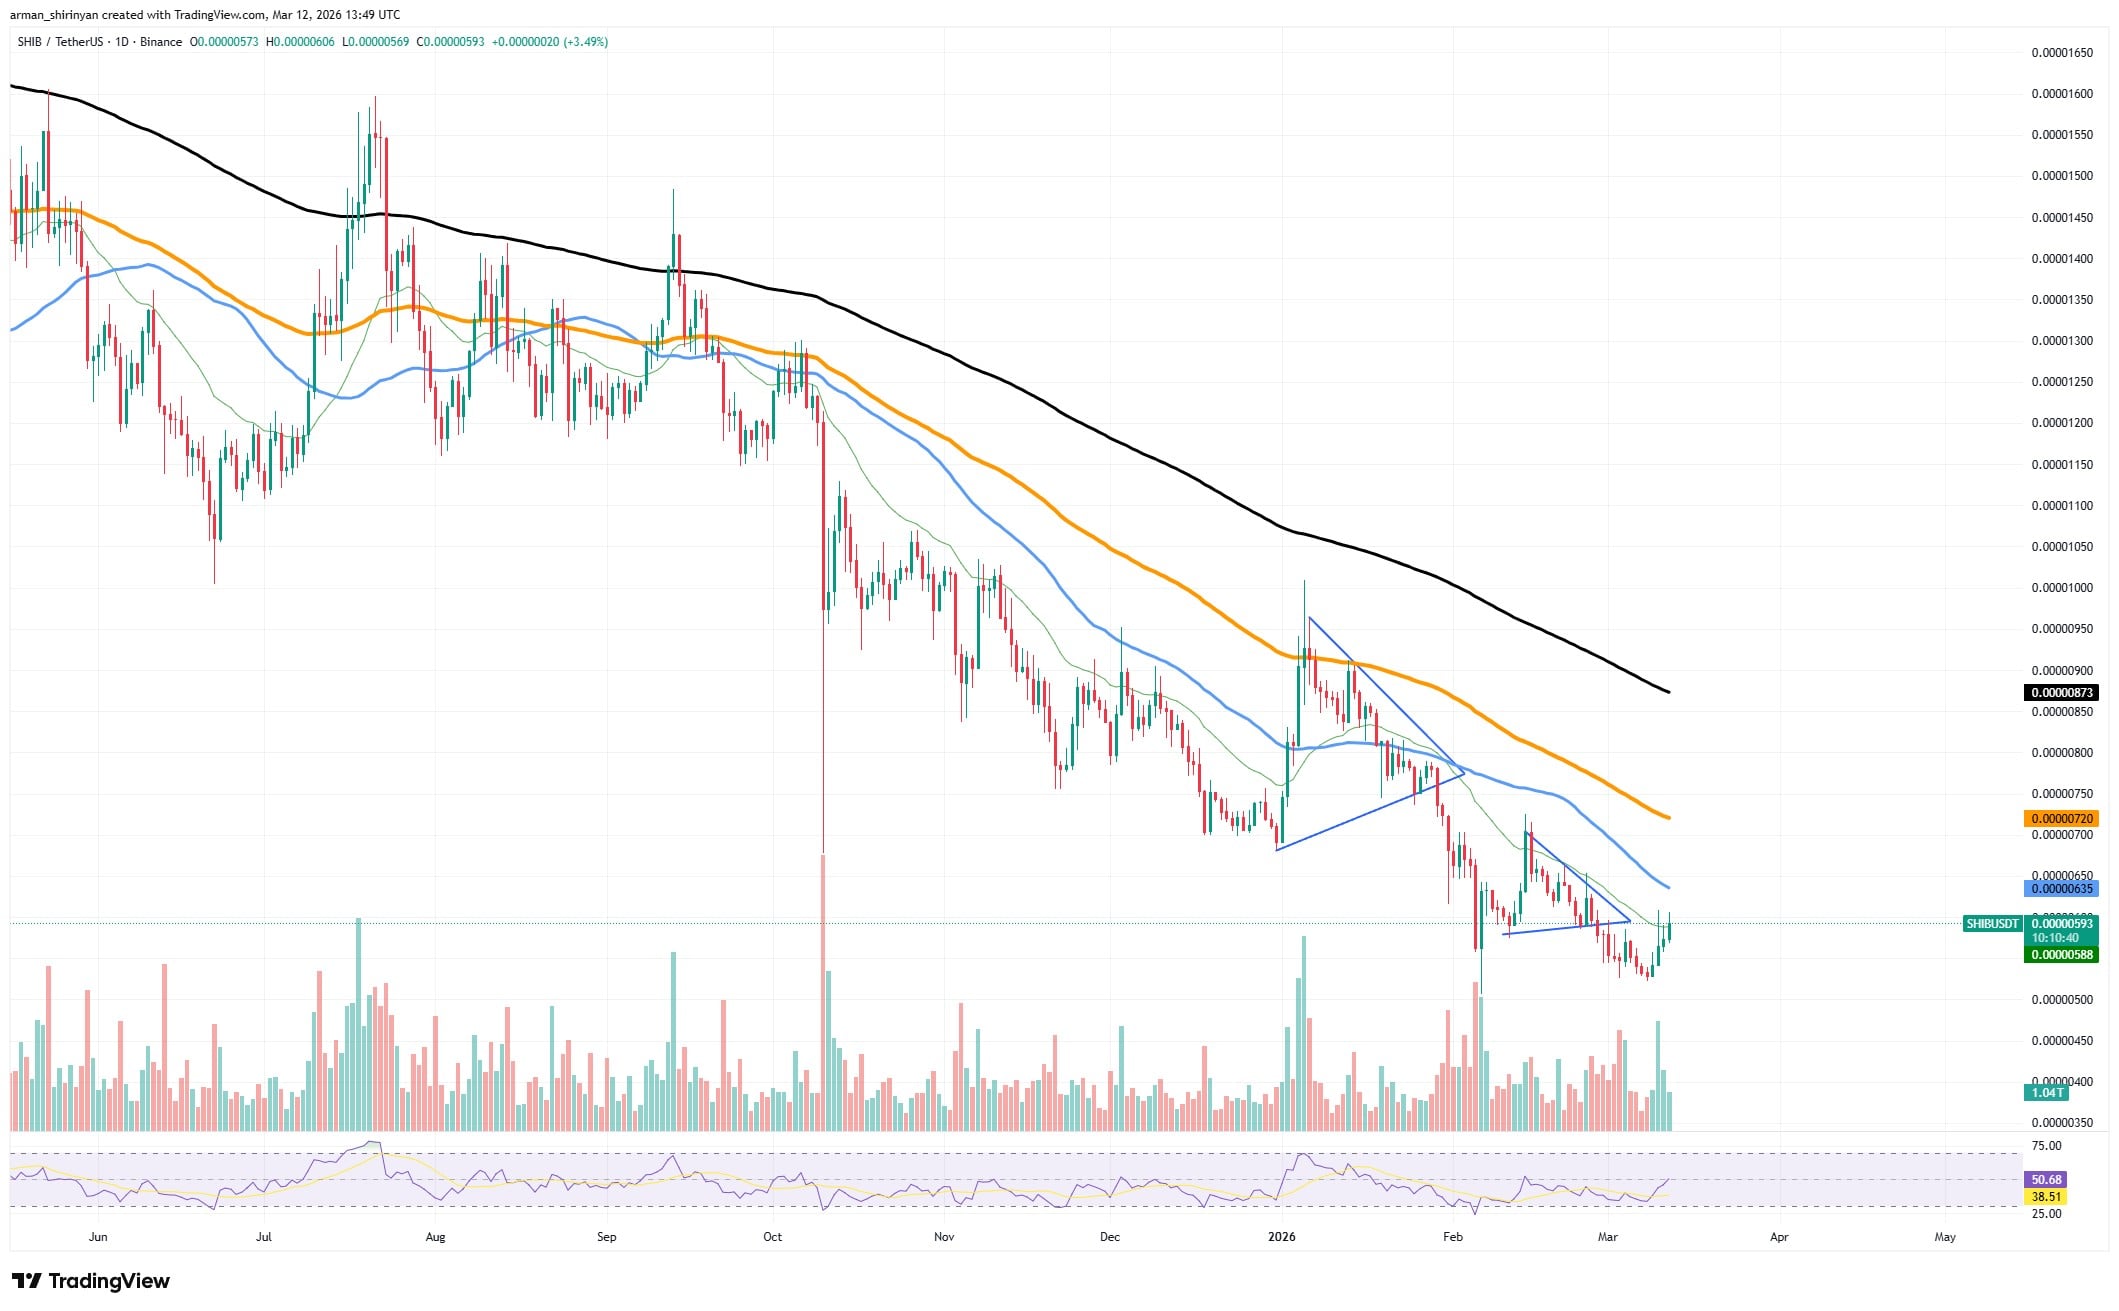
This kind of move frequently happens after a prolonged period of volatility suppression. Once the price breaks out of a narrowing structure, stop orders and short covering give the move more momentum, which can cause it to accelerate quickly. The breakout in SHIB’s case was accompanied by a discernible increase in trading activity, indicating that market players responded swiftly to the change in price action.
On the whole, though, the technical picture is still far from positive. Shiba Inu is still trading well below its important moving averages, such as the 26-day exponential moving average, which continues to serve as the first significant resistance level even after breaking out of the immediate consolidation pattern. A string of lower highs that have been forming for months continues to dominate the chart’s overall structure.

This suggests that, rather than a complete reversal of the trend, the current breakout might be a short-term relief move. The rally may quickly stall if the asset is unable to break above the surrounding resistance zone. The overall momentum environment is another important consideration. The market has not yet demonstrated the robust follow-through that would typically accompany a sustainable recovery, despite the breakout itself being sharp.
Cardano cannot bounce
Cardano is still stuck in a protracted bearish trend and is struggling close to its yearly lows. ADA is currently hovering around the $0.26 range, which essentially represents the bottom of its price range for the year following months of steady downward pressure. The asset seems to be gradually grinding against this floor rather than exhibiting indications of a clear recovery, which is indicative of poor momentum and little buying interest.
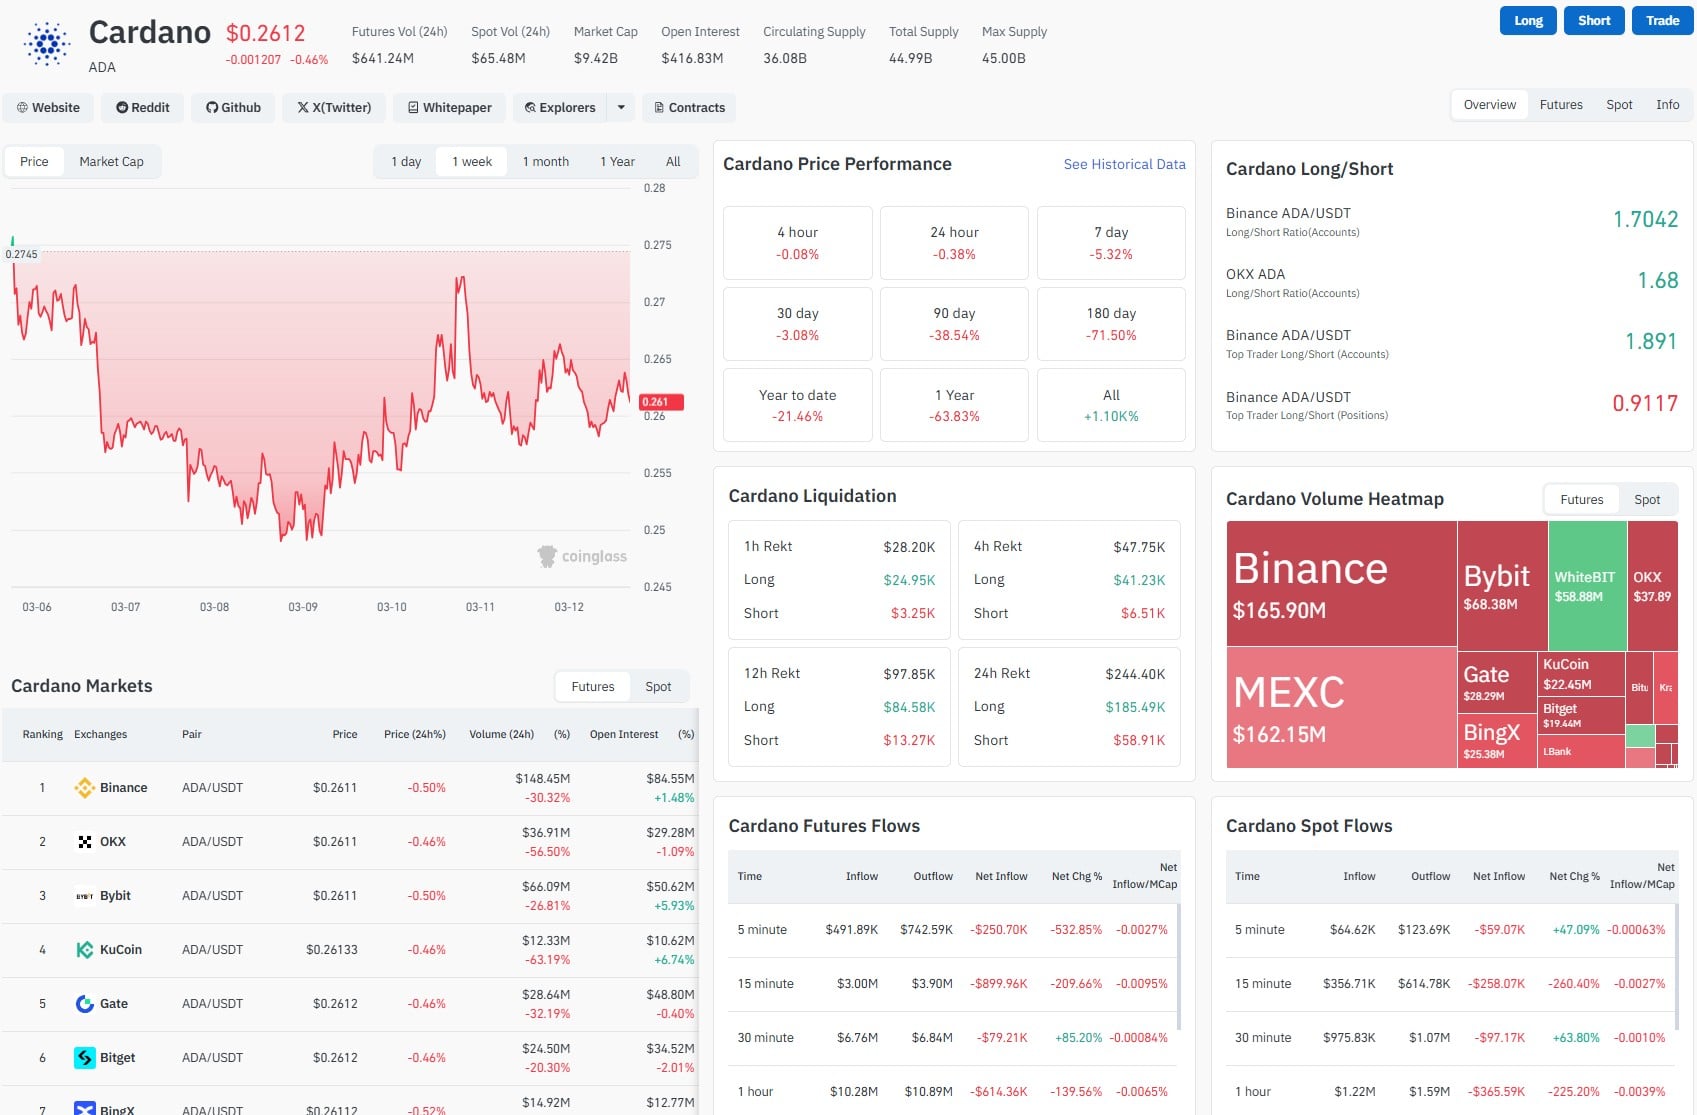
The overall structure of Cardano is still obviously negative from a technical perspective. A classic sign of persistent downward pressure, the chart displays a lengthy series of lower highs and lower lows. Over the past few months, every attempt at a recovery has been thwarted by declining resistance levels, which has kept the asset from developing any significant upward trend.
At the moment, ADA is trading significantly below all of its important moving averages, including the short-term trend indicators that usually serve as early warning signs of a possible reversal. The market’s negative structure is reinforced by the 26-day exponential moving average and other trend lines, which stay above the price and keep sloping downward.
ADA moving against support
Cardano looks to be slowly grinding along the support zone rather than forming a strong bounce from this level, indicating that buyers lack the conviction necessary to start a sustained rally. Instead of preparing for a recovery, this type of behavior frequently suggests that the market is still in the distribution phase.
Volume patterns corroborate this theory as well. Large buyers are not aggressively entering the market at current levels, as evidenced by the lack of a significant increase in trading activity during recent stabilization attempts. Even modest attempts at recovery are likely to fail against the larger bearish momentum in the absence of significant capital inflows.
In the future, Cardano faces the risk of the support itself becoming weaker due to extended consolidation close to the bottom. The market may eventually test lower levels in an effort to find greater buying interest if the asset is unable to create enough demand to move higher.
Bitcoin aiming higher
As the market starts to test levels slightly above the $70,000 range, Bitcoin is getting closer to another crucial moment. The top cryptocurrency is now exhibiting early indications of strength that could enable it to regain a crucial psychological threshold after weeks of stabilization following a severe correction earlier in the year.
As of this writing, Bitcoin is trading near $70,400, with price action progressively rising after establishing a base around $60,000. After a protracted period of selling pressure that dominated previous months, the recent movement indicates that buyers are gradually regaining control of the market.

The $70,000 barrier, which has significant psychological implications for traders, is the most significant upcoming milestone. This zone has previously been briefly tested by Bitcoin, but it was difficult for it to stay above it for long. The beginning of a more significant momentum shift may be indicated if the asset is able to break through and continue trading above this threshold.

Technically speaking, the chart indicates that demand is starting to build beneath the market by showing Bitcoin forming a structure of higher lows. This pattern frequently emerges in the early phases of recovery as buyers progressively give in to selling pressure.
The next target could swiftly move toward the $71,000 range, which now seems attainable if Bitcoin manages to reclaim the $70,000 mark and stay above it. As traders respond to the renewed strength, a decisive breakout may also result in more buying pressure.
 Dan Burgin
 U.Today Editorial Team