
Disclaimer: The opinions expressed by our writers are their own and do not represent the views of U.Today. The financial and market information provided on U.Today is intended for informational purposes only. U.Today is not liable for any financial losses incurred while trading cryptocurrencies. Conduct your own research by contacting financial experts before making any investment decisions. We believe that all content is accurate as of the date of publication, but certain offers mentioned may no longer be available.
XRP has entered a technically weak phase after losing the multi-month support zone around $1.30. The daily chart shows a prolonged downtrend with price trading below all major moving averages, while the 200-day MA remains far above current levels near $1.60. That gap highlights how much damage the recent selloff has inflicted on the structure.
The most important development is the breakdown from the descending triangle that had formed between March and May. Bulls repeatedly defended the $1.30 floor, but sellers eventually overwhelmed demand, triggering a sharp move lower. Such patterns often produce a measured move after support gives way, and XRP is currently attempting to stabilize around $1.14.
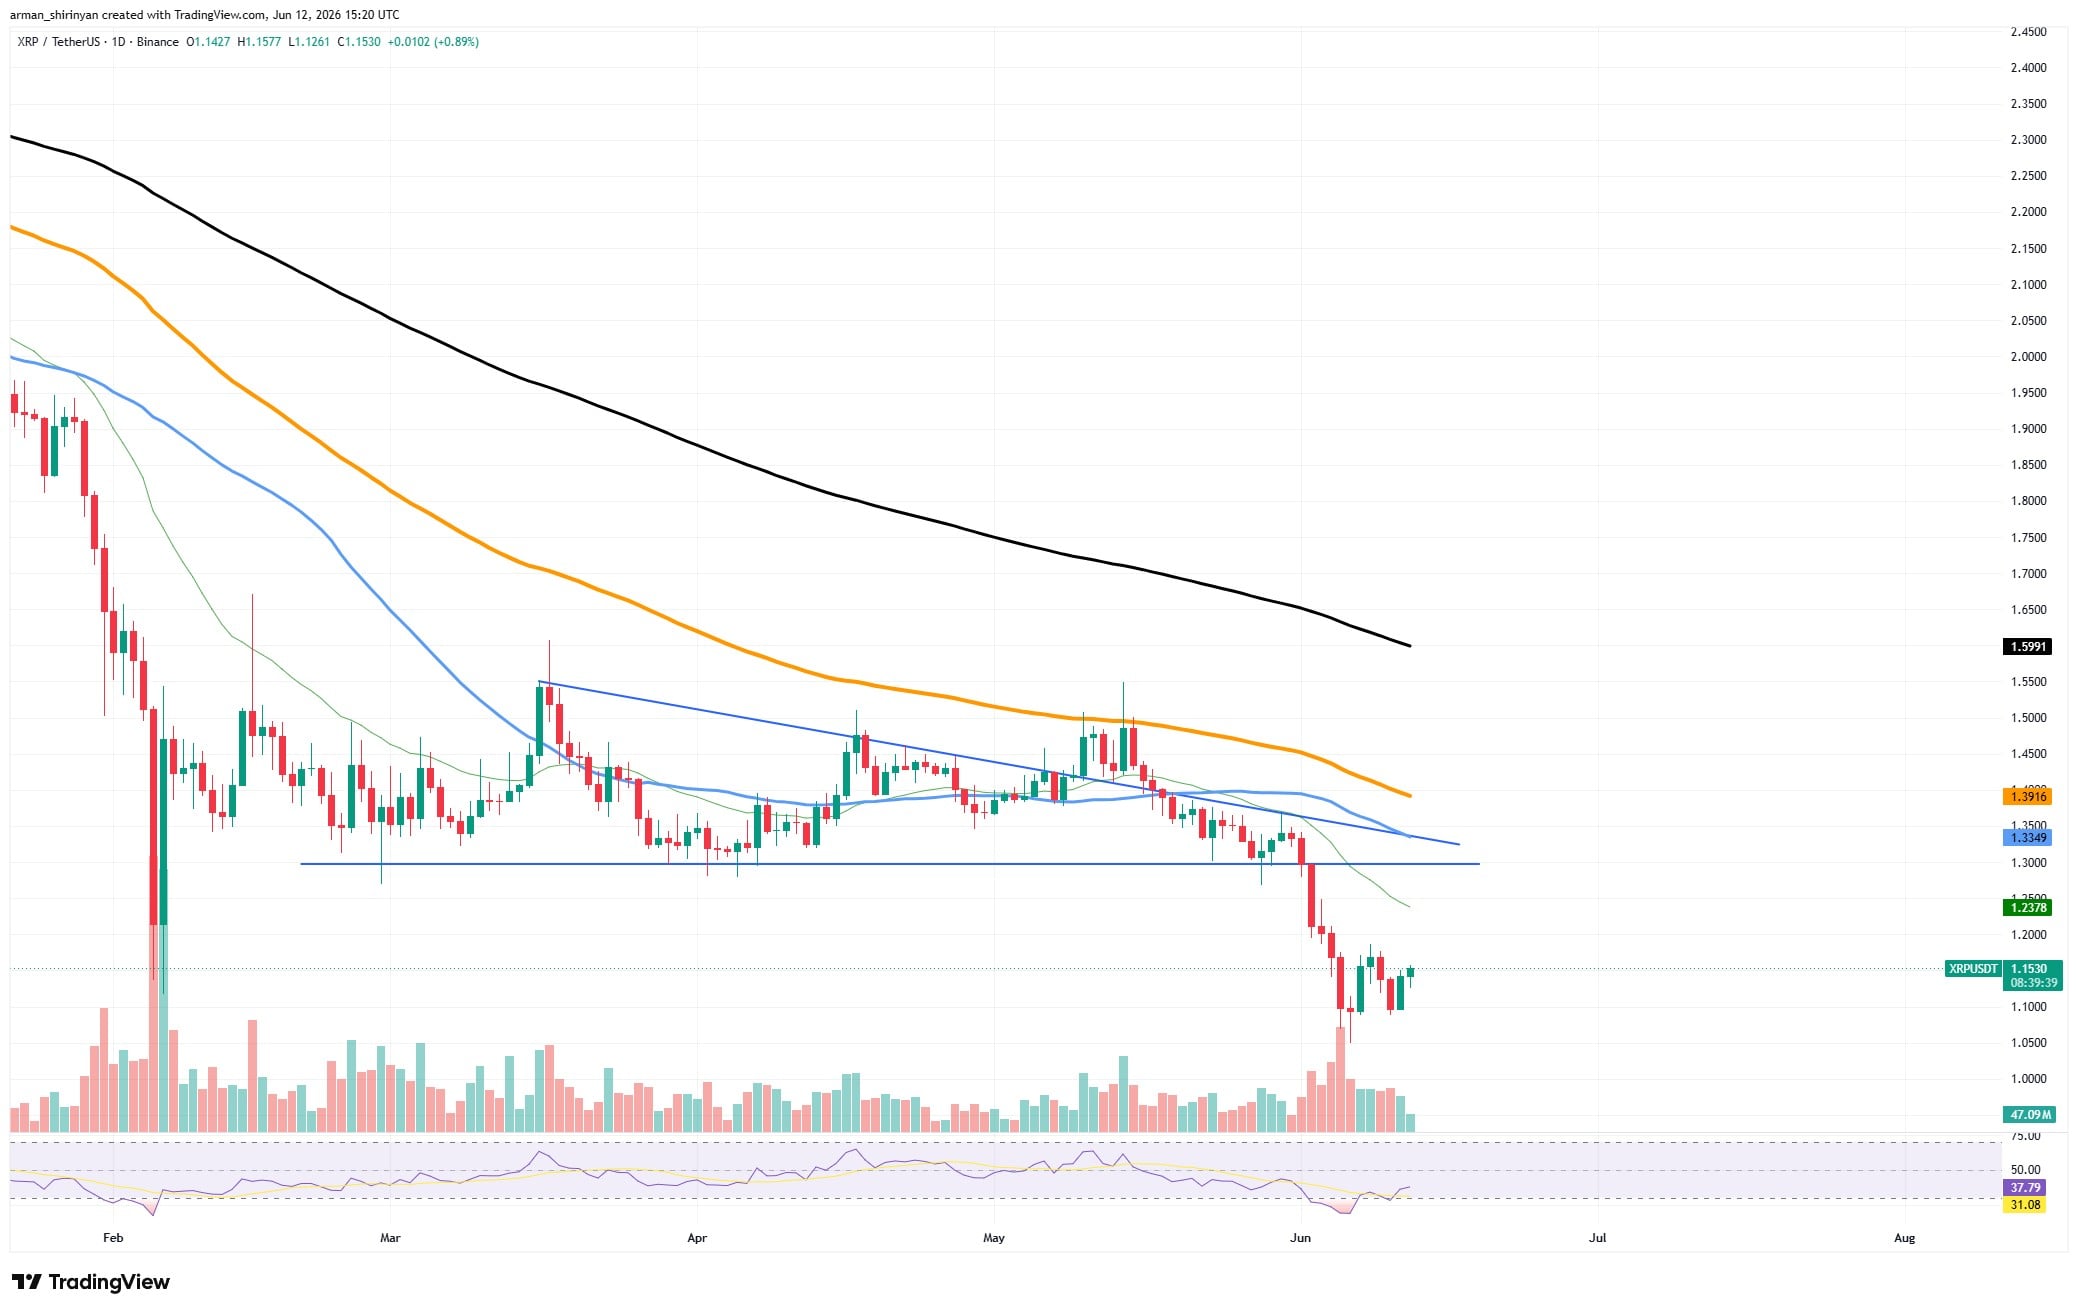
Momentum indicators are also struggling. RSI briefly entered oversold territory before bouncing slightly, suggesting some short-term relief may occur. However, oversold conditions alone do not guarantee a reversal. During strong downtrends, assets can remain oversold for extended periods while continuing to grind lower.
For bulls, reclaiming $1.30 is now the first major challenge. That former support has likely become resistance, reinforced by the cluster of moving averages directly overhead. Unless XRP can recover that area and hold above it, any bounce may simply be a relief rally within a broader bearish trend.
On the downside, failure to maintain the current range could expose psychological support near $1.00. Markets often gravitate toward round-number levels after major breakdowns, making that zone a natural target for traders.
The bigger picture remains mixed. XRP has already corrected heavily from its highs, which reduces some downside risk compared to earlier stages of the decline. At the same time, there is still no convincing evidence that a long-term bottom has formed. Traders should watch for higher lows, increasing volume on green days, and a recovery above $1.30 before calling for a sustainable reversal.
Zcash has to regain the trust
ZEC's long-term structure is still stronger than that of many significant altcoins despite the sharp volatility. Whether the recent collapse was just a violent reset or the start of a more significant trend reversal will be revealed over the coming weeks.
Despite going through one of the biggest liquidations this month, Zcash is proving to be far more resilient than many other altcoins.
ZEC successfully staged an aggressive recovery after falling from above $600 to almost $250 in a matter of days, and it is currently consolidating at about $430.
ZEC is still above its 200-day moving average at $370 despite a decline in short-term momentum. That level continues to be the boundary between a sound long-term uptrend and a more severe bearish reversal. It also served as support during the panic selloff.
Rather than a gradual deterioration of the trend, Zcash's recent collapse was largely triggered by the discovery of a bug that allowed unauthorized generation of ZEC, sparking panic across the market. The news led to a wave of forced liquidations and aggressive selling, causing volume to surge to extreme levels.
Despite the shock, buyers stepped in almost immediately after the flush, producing a strong recovery candle and preventing a complete breakdown of the broader market structure. The swift rebound suggests that while confidence was shaken by the exploit-related concerns, many participants viewed the selloff as an overreaction rather than a fundamental threat to the long-term viability of the network.
ZEC is currently caught between resistance at $450-$500 and support at $400. Upside growth is constrained by the 50-day and 100-day moving averages, which are still above. Selling pressure may persist on recovery attempts as long as the price remains below those levels.
ZEC's long-term structure is still stronger than that of many significant altcoins despite the sharp volatility. Whether the recent collapse was just a violent reset or the start of a more significant trend reversal will be revealed over the coming weeks.
Toncoin's path to recovery
After weeks of erratic price movement, Toncoin has stabilized, but the chart still shows a market looking for guidance rather than a definitive uptrend.
Sellers swiftly regained control after the May explosive rally above $2.80, forcing TON into a sharp correction that erased much of the advance.
The token's ability to recover and hold above the 100-day moving average near $1.68 is a positive indication for bulls. Additionally, the price is fluctuating around the cluster created by the 50-day and 200-day moving averages, which serves as a battlefield for buyers and sellers.
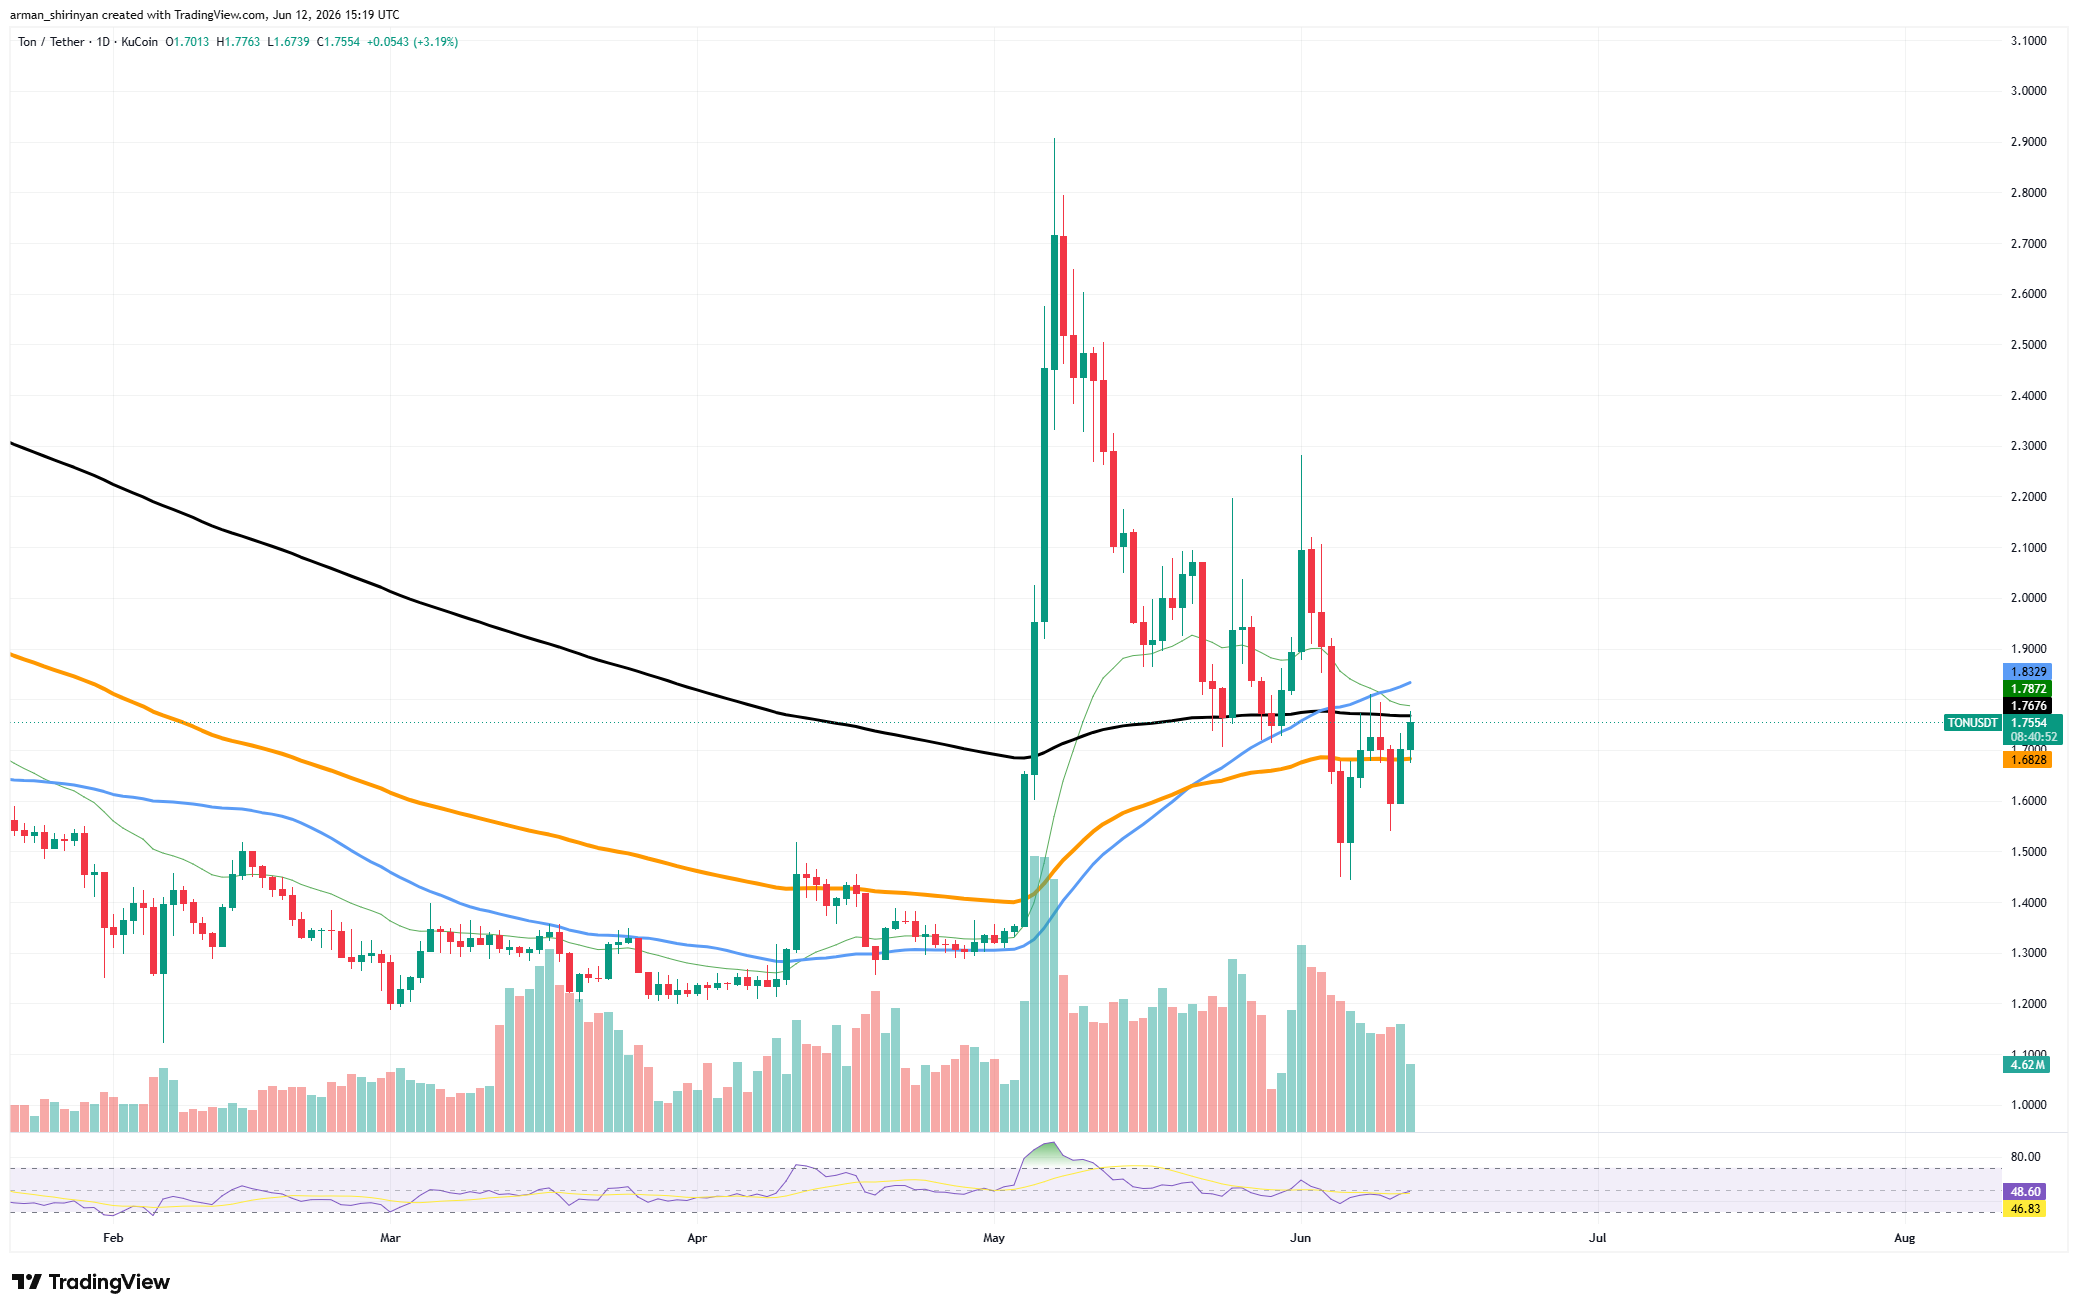
TON is at least making an effort to create support around these crucial levels, in contrast to many altcoins that remain well below long-term trend indicators.
The panic selling phase may be coming to an end, as volume has significantly decreased since the May spike. But momentum does not change. When the RSI is close to the middle of its range, it is neither overbought nor oversold. This frequently comes before a more significant move when a clear catalyst appears.
Several moving averages converge in the main resistance zone, which is located between $1.80 and $1.85. The technical picture would be greatly enhanced by a clear breakout above that area, which might pave the way for the psychologically significant $2.00 level. The May swing highs would then be the next important target.
On the downside, another test of the recent lows around $1.50 is more likely if support around $1.68 is not maintained. The notion that the post-rally correction is still ongoing would be strengthened by such an action.
Compared to many large-cap altcoins, TON's structure appears to be much healthier overall. The asset has recovered significant technical levels, avoided total collapse, and is establishing a foundation.
Proving that buyers can maintain momentum above the dense resistance cluster directly overhead is the next obstacle.
Shiba Inu's relevance is decreasing
From a technical standpoint, Shiba Inu continues to be among the weaker major meme coins. The daily chart confirms a bearish continuation pattern rather than a brief pullback by clearly breaking out of a multi-month rising channel.
SHIB traded within an ascending structure during the months of March, April, and May, which at first glance seemed positive. But rather than rising, the price lost the lower trendline support and quickly declined. Before buyers eventually intervened, that breakdown set off a wave of selling that drove SHIB toward the $0.0000045 area.
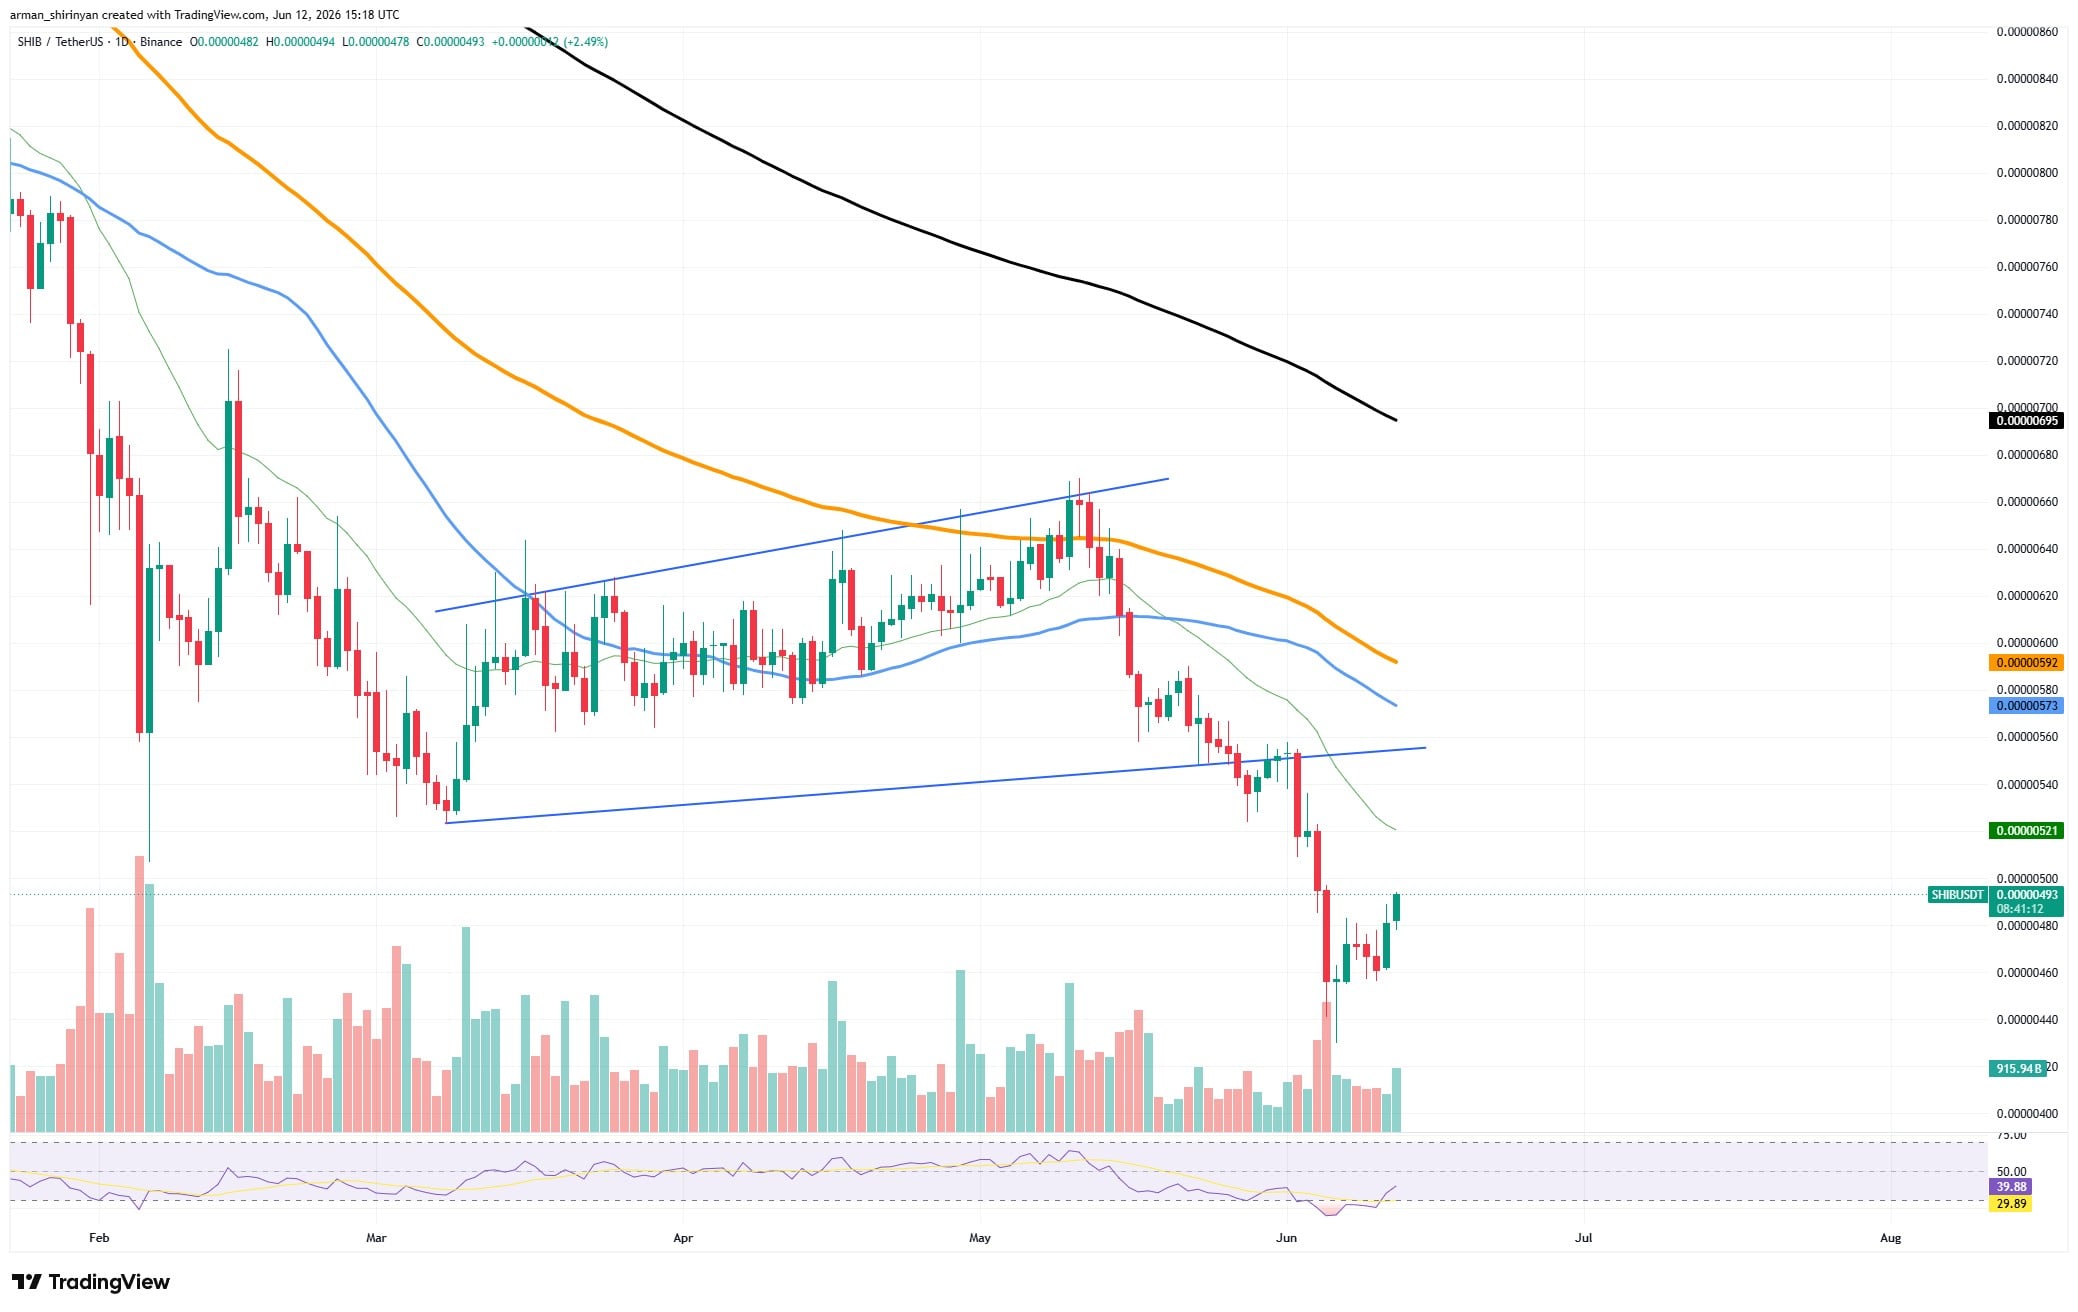
Although noteworthy, the recent recovery must be understood in its context. The price is still below the 50-, 100-, and 200-day moving averages, which are still sloping downward. A market where sellers retain control over a variety of time periods is usually reflected in this alignment.
The current bounce can be explained by the RSI's recent entry into oversold territory before it recovered. Oversold readings don't always indicate a trend reversal, even though they frequently result in relief rallies. In order for that to occur, SHIB would have to start creating higher highs and higher lows and recover a number of resistance levels.

Bulls face their first obstacle at $0.0000055, which is close to the broken channel support. This zone is especially crucial because, after a breakdown, former support frequently turns into resistance.
The moving average cluster around $0.0000058-$0.0000060 represents an even more formidable barrier above that.
The recent lows around $0.0000045 will once again be the focus of attention if buyers are unable to maintain the recovery. A breakdown below that level might prolong SHIB's bearish trend and lead to another leg lower.
As of right now, the market seems to be going through a technical recovery following strong selling pressure. Although the recovery is positive, the overall trend is still negative until SHIB can recover important resistance areas and disprove the recent channel breakdown.
 Dan Burgin
 U.Today Editorial Team