Disclaimer: The opinions expressed by our writers are their own and do not represent the views of U.Today. The financial and market information provided on U.Today is intended for informational purposes only. U.Today is not liable for any financial losses incurred while trading cryptocurrencies. Conduct your own research by contacting financial experts before making any investment decisions. We believe that all content is accurate as of the date of publication, but certain offers mentioned may no longer be available.
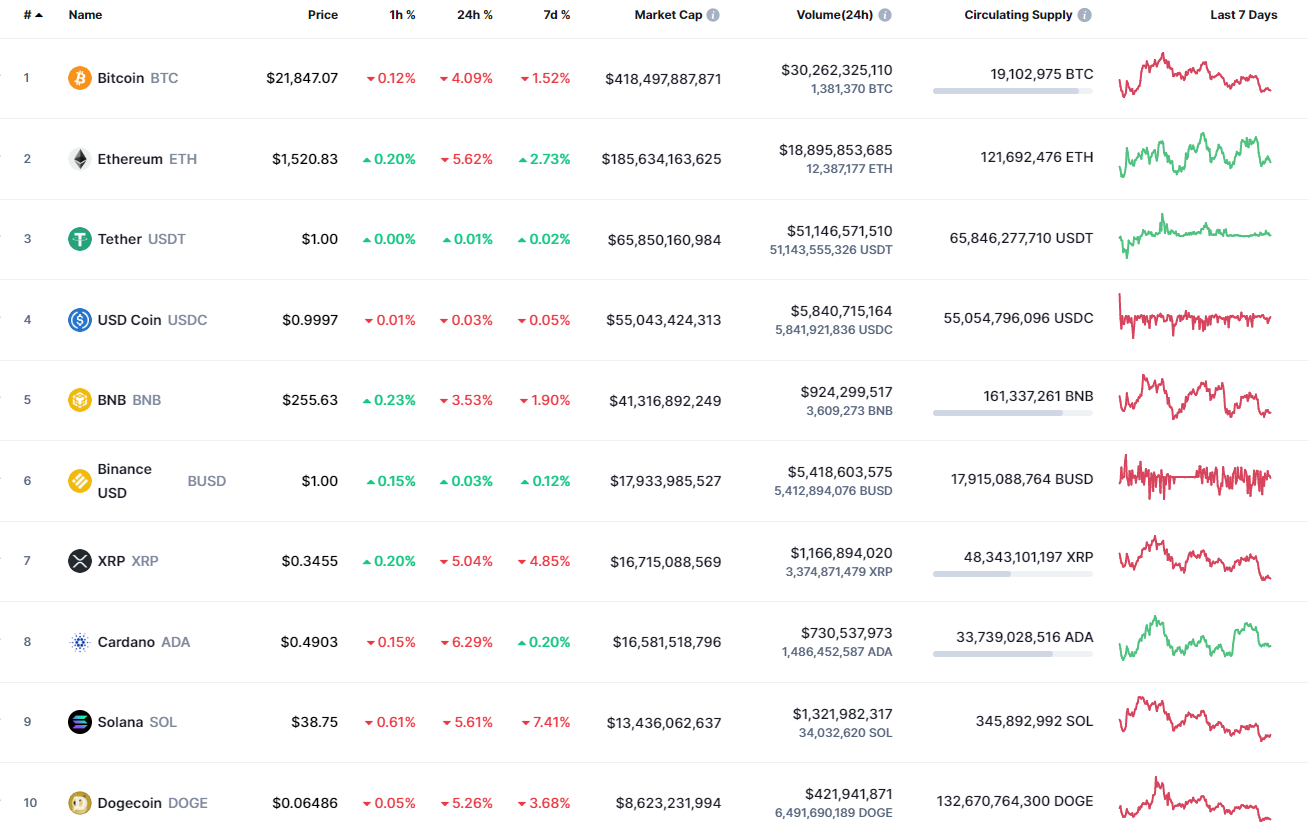
The new week has begun with a correction on the cryptocurrency market as most of the coins have returned to the red zone.
BTC/USD
Bitcoin (BTC) has fallen the least from the list today with a decline of 4.50%.
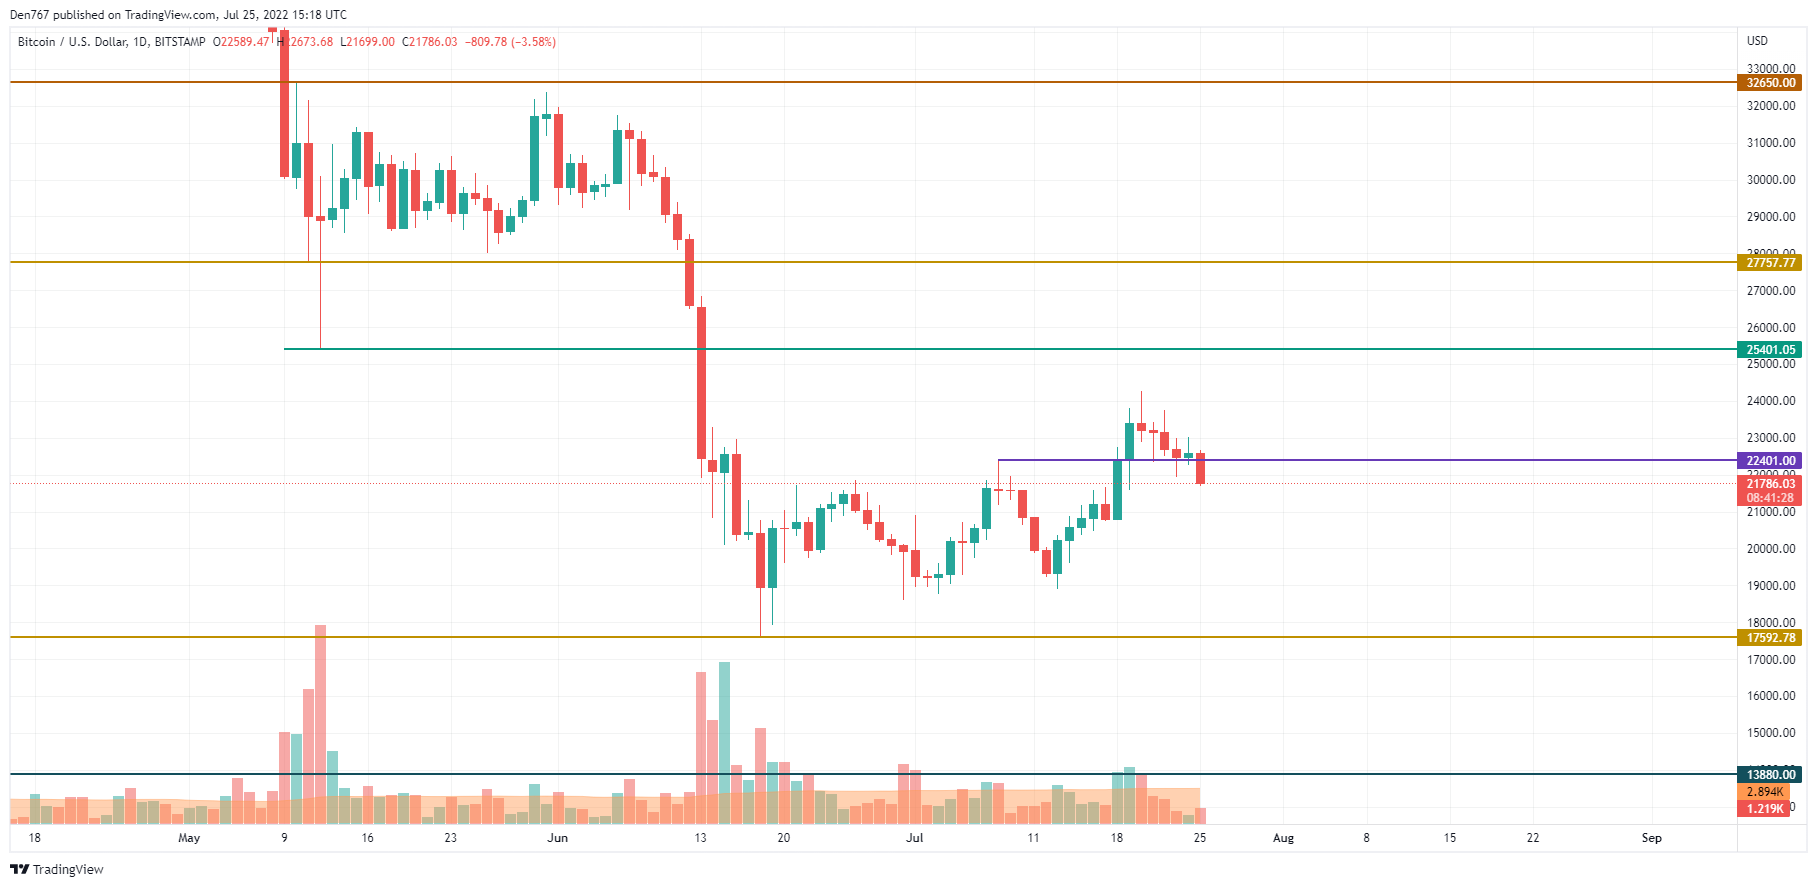
Bitcoin (BTC) has made a breakout of the $22,400 mark on the daily chart, confirming buyers' weakness and lack of power for a further rise. Thus, the leading coin is below $22,000, which means that bears have locally seized the initiative.

If the situation does not change by the end of the day, there are high chances to see the test of the $21,000 area this week.
Bitcoin is trading at $21,799 at press time.
ETH/USD
Ethereum (ETH) is the biggest loser from the list today as the rate of the main altcoin has dropped by almost 6% over the last 24 hours.
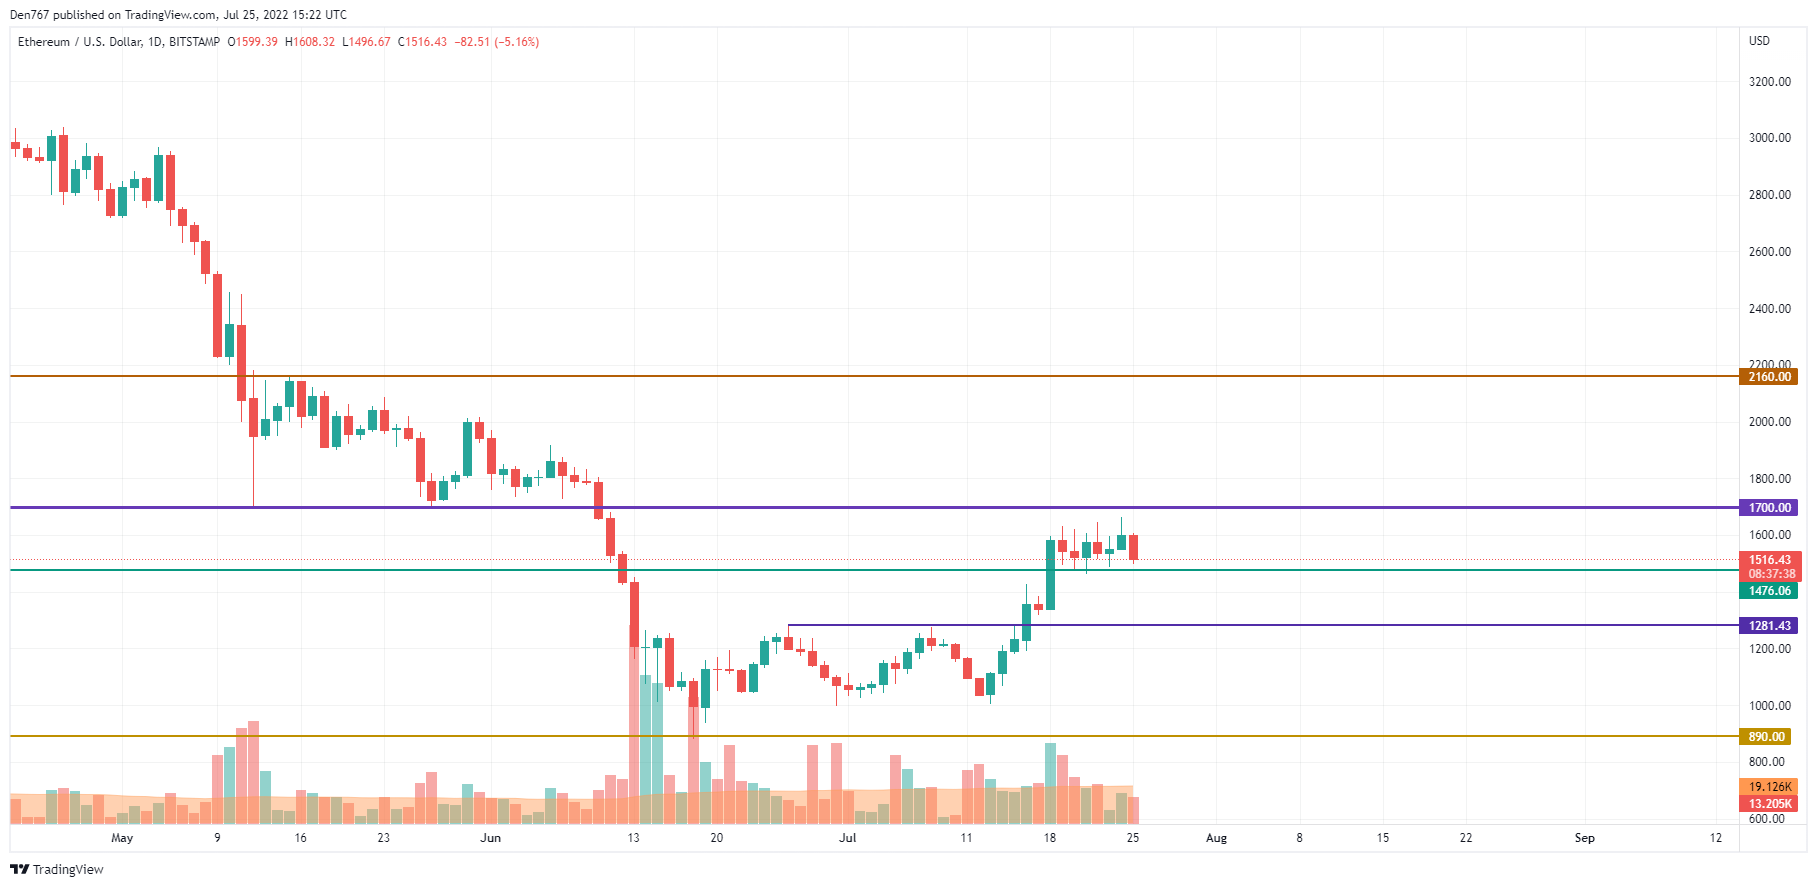
After the failed attempt to fix above the $1,600 mark, Ethereum (ETH) is on its way to testing the local support level at $1,476. At the moment, one should pay attention to $1,500. If buyers lose this level, the decrease to the $1,400-$1,450 zone might happen within the next few days.
Ethereum is trading at $1,517 at press time.
XRP/USD
XRP is no exception from the rule, going down by 5.55%.
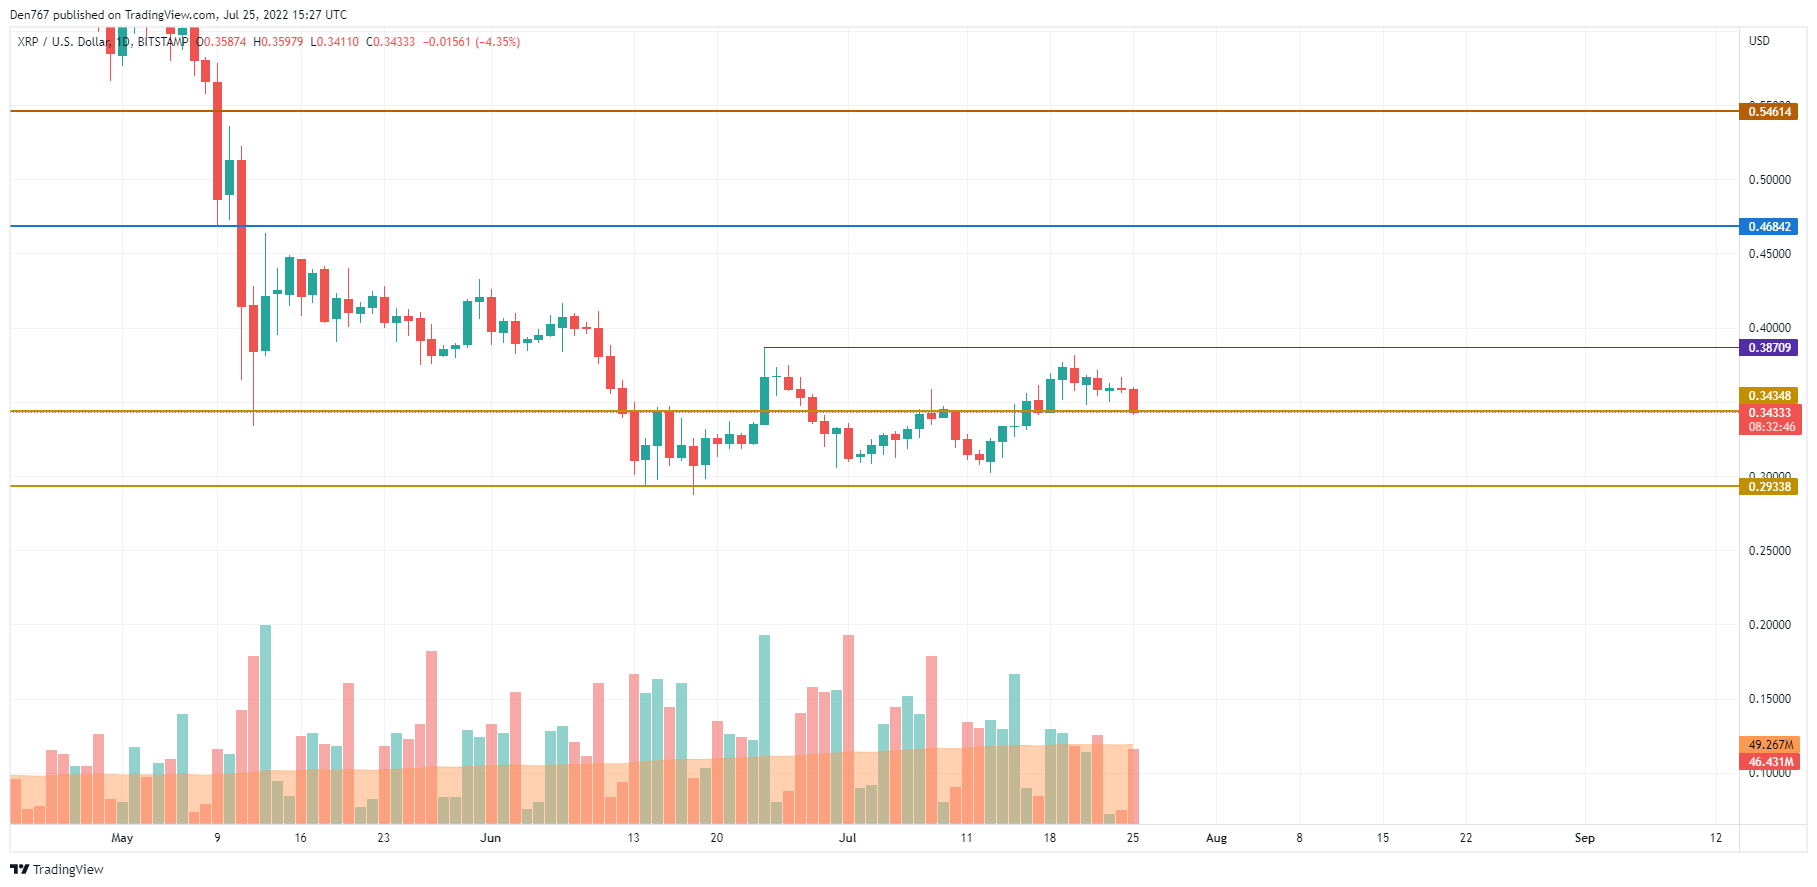
XRP has approached the support level at $0.3434 on the daily chart. The selling volume has increased, which means that bears are more powerful than bulls at the moment. In this case, the more likely scenario is the test of the $0.33 area soon.
XRP is trading at $0.3442 at press time.
 Dan Burgin