Disclaimer: The opinions expressed by our writers are their own and do not represent the views of U.Today. The financial and market information provided on U.Today is intended for informational purposes only. U.Today is not liable for any financial losses incurred while trading cryptocurrencies. Conduct your own research by contacting financial experts before making any investment decisions. We believe that all content is accurate as of the date of publication, but certain offers mentioned may no longer be available.
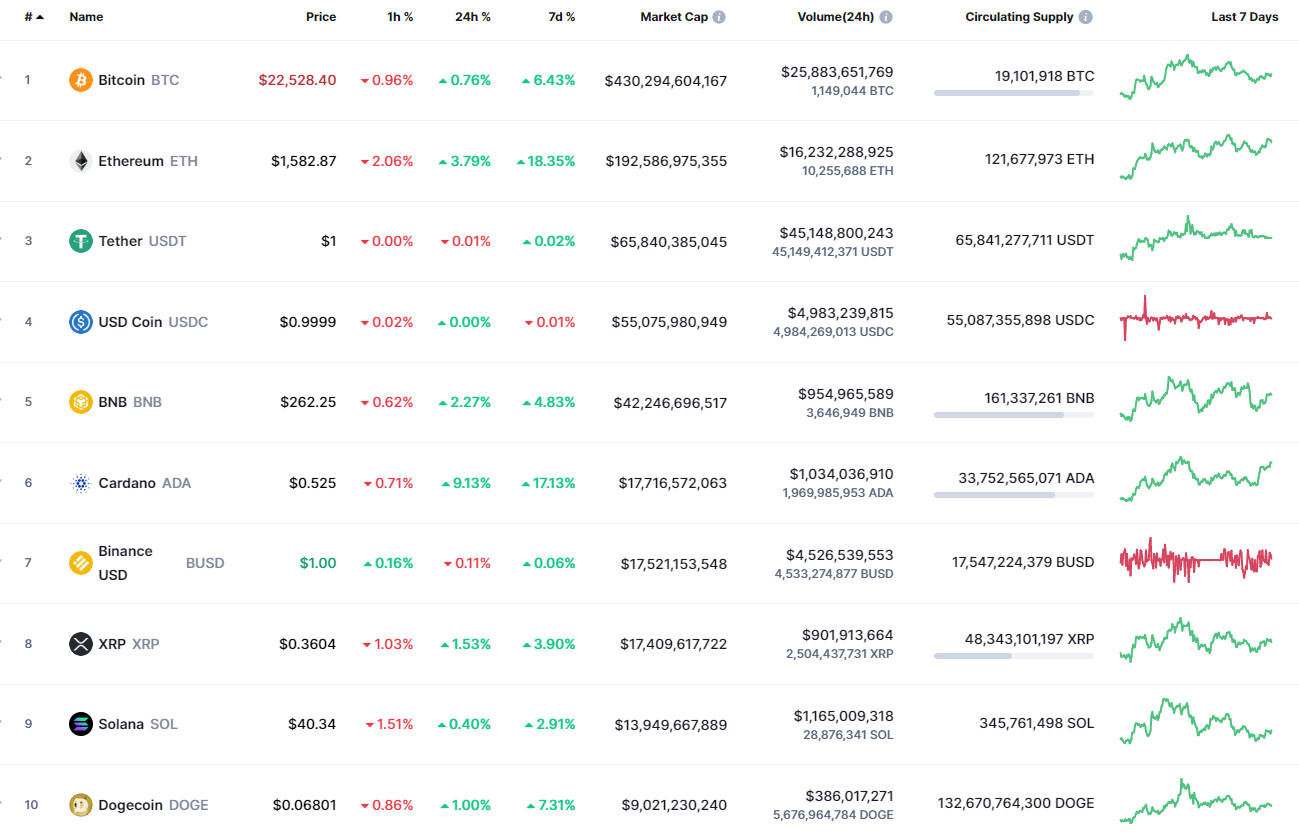
On the last day of the week, bulls have seized the initiative as all the top 10 coins are again in the green zone.
BTC/USD
The rate of Bitcoin (BTC) has risen by 6.29% over the last 7 days.
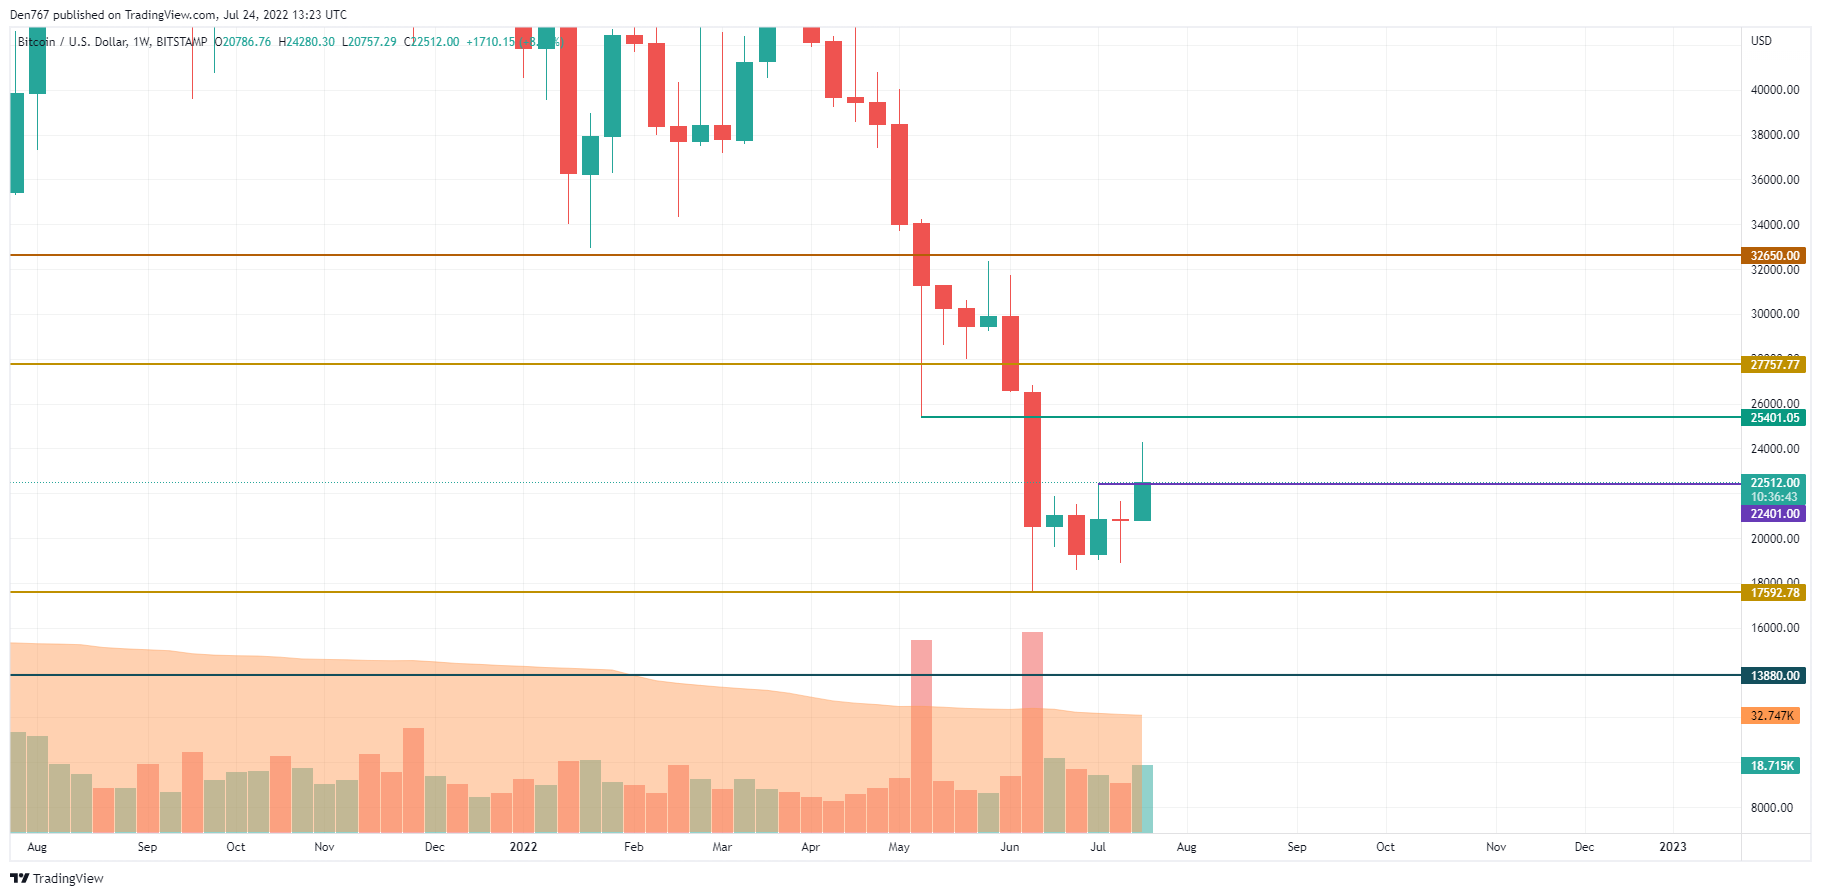
From the midterm point of view, Bitcoin (BTC) is about to fix above the $22,400 mark. In addition, sellers' power is accompanied by high volume, which means that there are high chances to see a further rise next week.

All in all, overcoming the aforementioned level might be a prerequisite for an upward move to the $24,000 zone next week.
Bitcoin is trading at $22,525 at press time.
DOGE/USD
DOGE has outperformed Bitcoin (BTC), as it has risen by 6.72% this week.
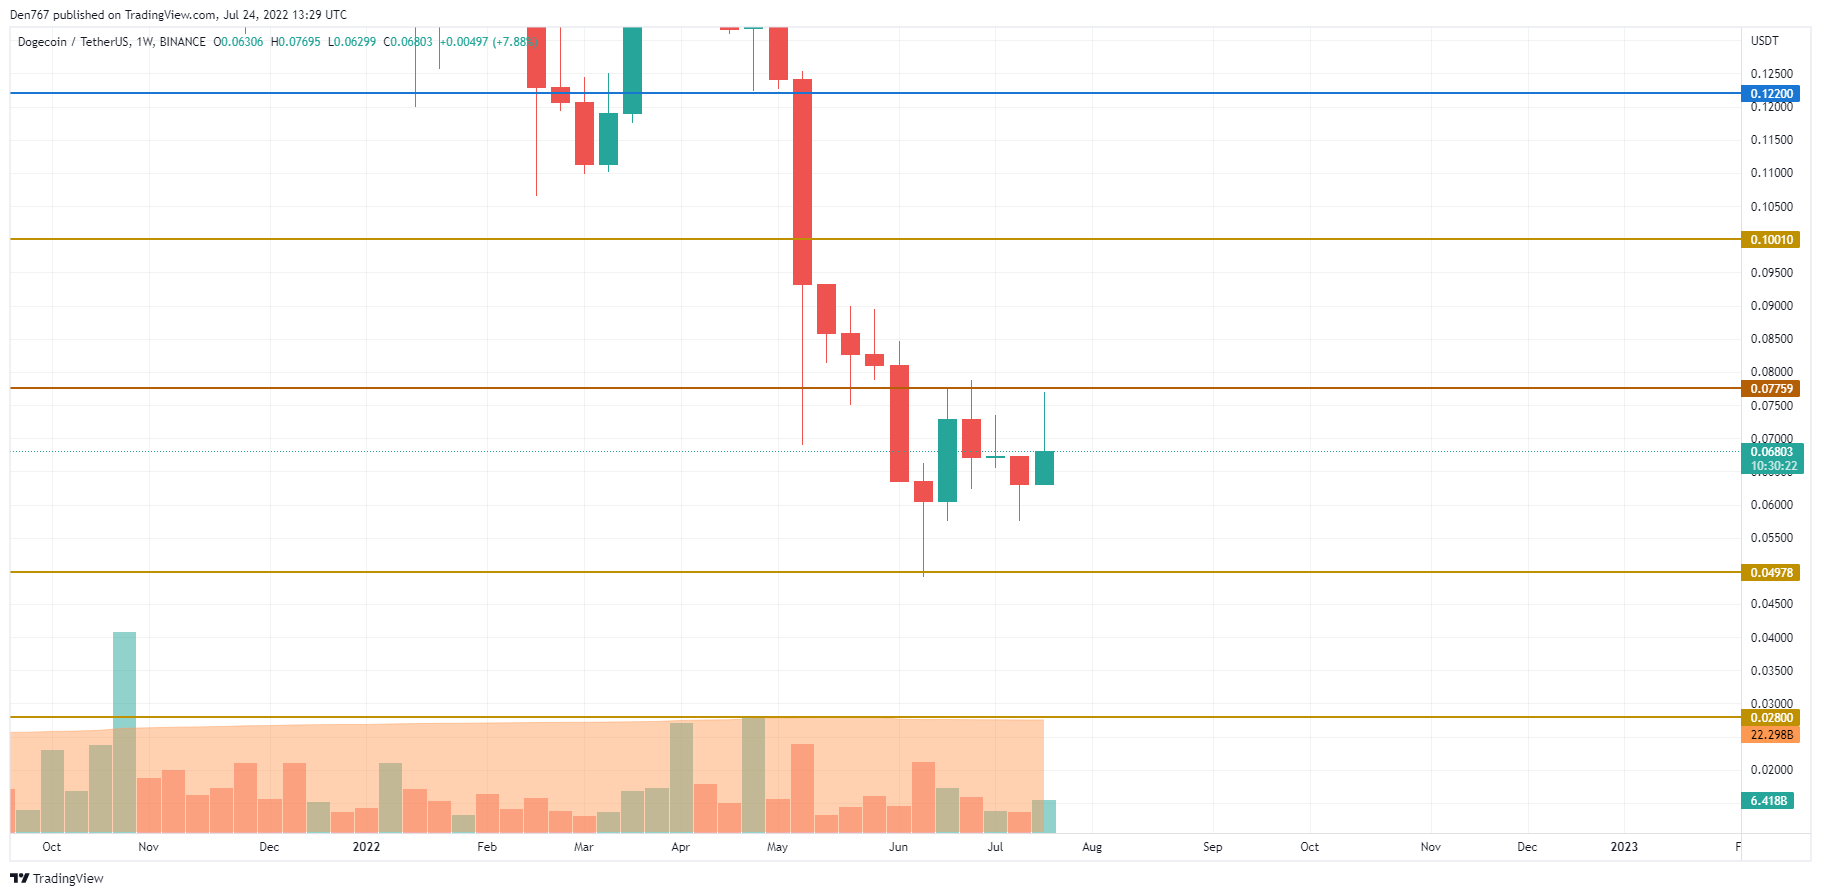
Despite the rise, DOGE is trading sideways as the rate is located in the middle of the wide channel between the support at $0.04978 and the resistance at $0.07759. The low volume confirms that neither side is ready for a sharp move. Growth is only possible if DOGE returns to the $0.07 mark and fixes there.
DOGE is trading at $0.06789 at press time.
SHIB/USD
SHIB has seen the most growth on today's list as the price has rocketed by almost 7% over the past week.
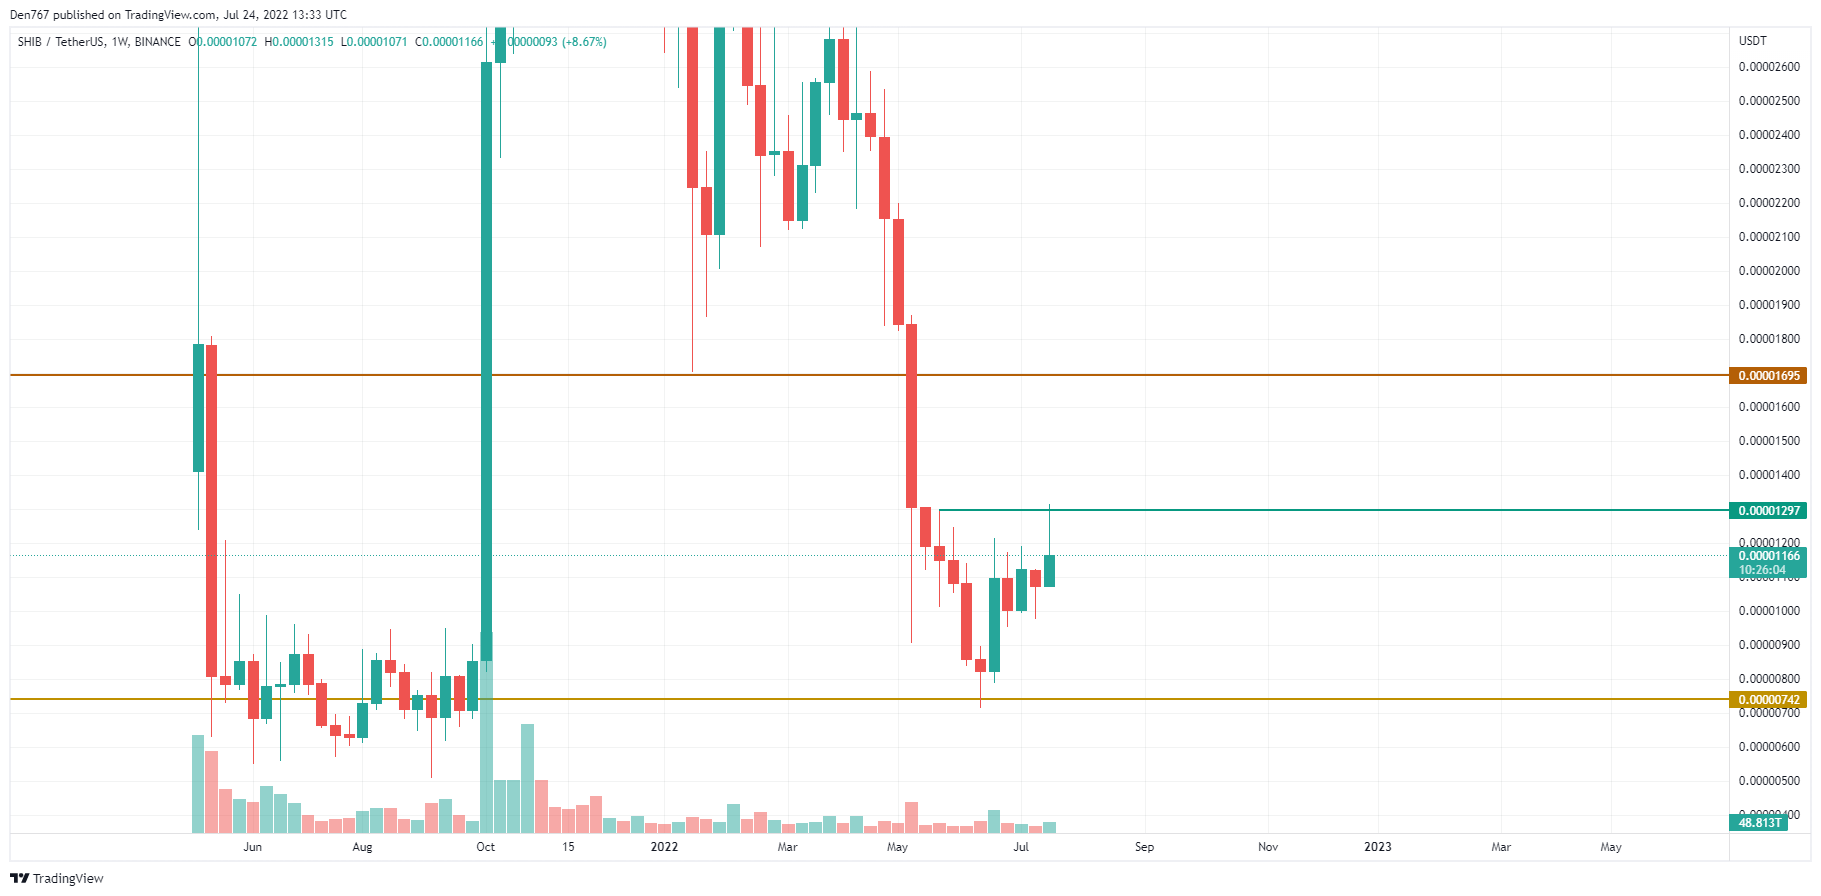
SHIB has made a false breakout of the local resistance level at $0.00001297. While the rate is below it, bears tend to be more powerful than bulls. In this case, the more likely scenario is a consolidation in the range of $0.000011 — $0.0000012 so buyers could get more power for a further move.
SHIB is trading at $0.00001167 at press time.
 Dan Burgin
 U.Today Editorial Team