
Disclaimer: The opinions expressed by our writers are their own and do not represent the views of U.Today. The financial and market information provided on U.Today is intended for informational purposes only. U.Today is not liable for any financial losses incurred while trading cryptocurrencies. Conduct your own research by contacting financial experts before making any investment decisions. We believe that all content is accurate as of the date of publication, but certain offers mentioned may no longer be available.
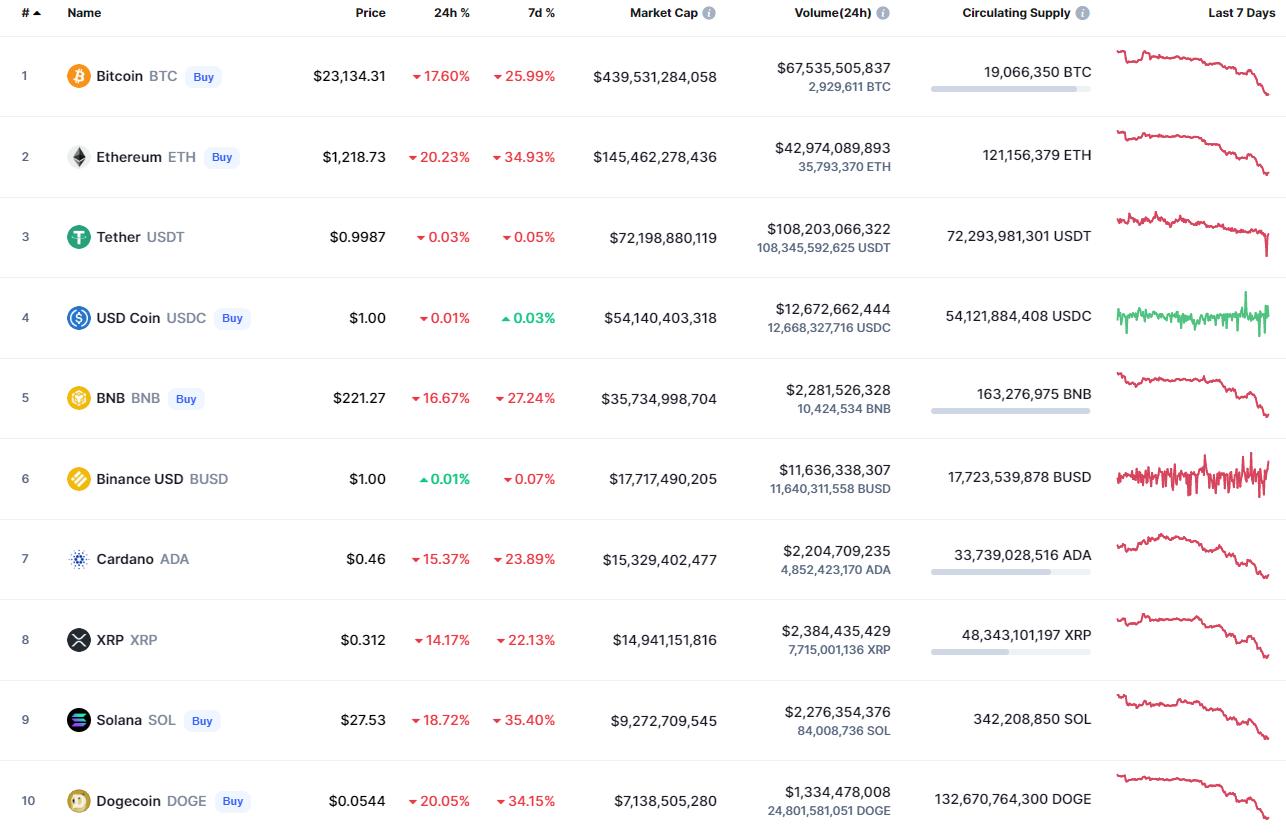
The week has started with the sharp fall of the cryptocurrency market as all top 10 coins are in the red zone.
BTC/USD
The price of Bitcoin (BTC) has declined by 18% over the last 24 hours.
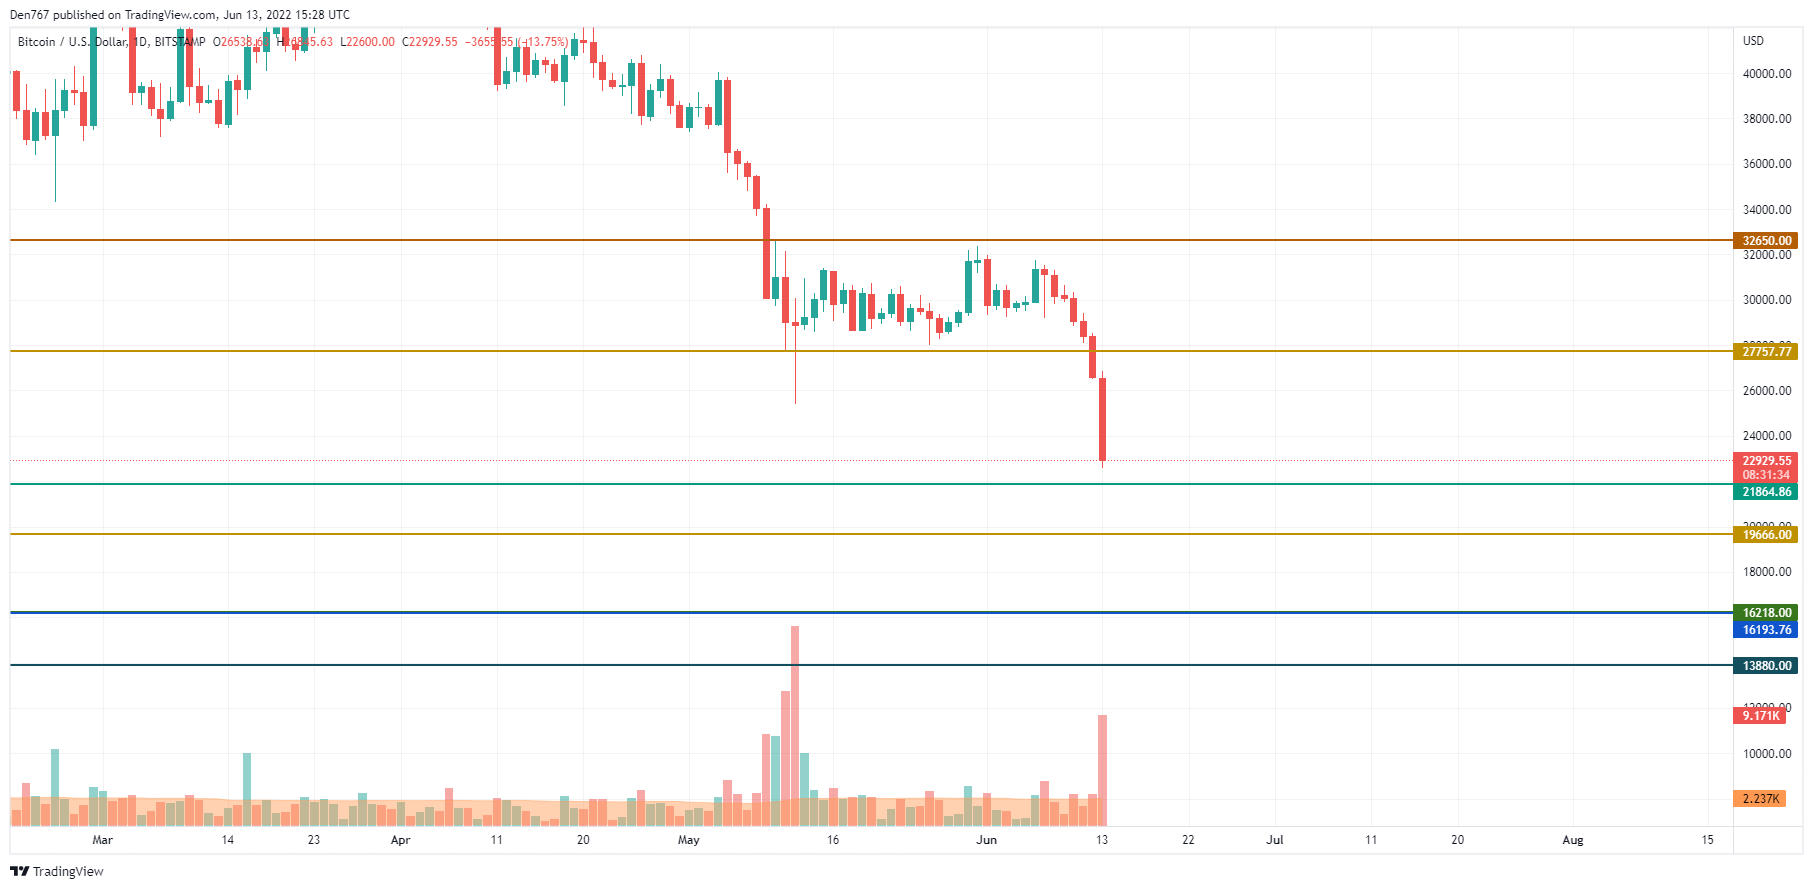
On the daily chart, Bitcoin (BTC) has almost reached the support level at $21,864. The decline has been stopped at the $23,000 mark which means that there is a chance of seeing a price bounce.

If that happens, one can expect the test of the formed mirror level at $25,400. Such a scenario is relevant until the end of the week.
Bitcoin is trading at $23,139 at press time.
DOGE/USD
DOGE is the biggest loser from the list today, going down by more than 20% since yesterday.
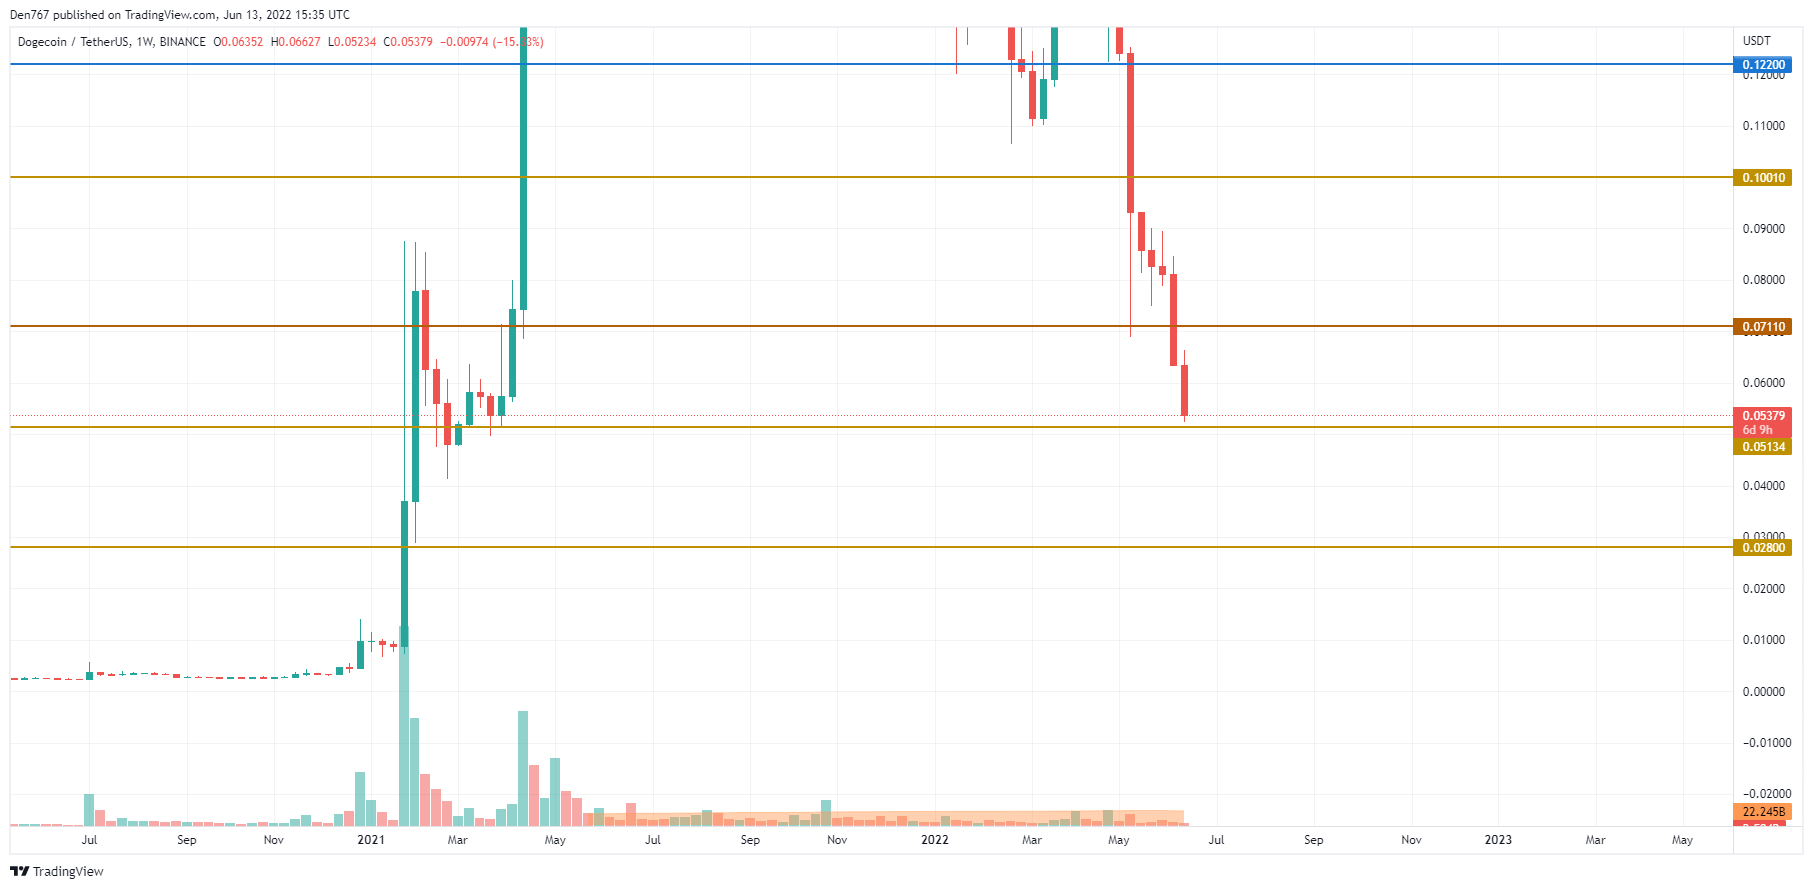
DOGE has also almost reached its weekly support level at $0.05134. The selling trading volume is low which means that bears might have run out of power in terms of the current decline. Respectively, if buyers can hold the zone around $0.05, the short-term correction is possible to the $0.06 mark.
DOGE is trading at $0.05408 at press time.
SHIB/USD
SHIB is the least falling coin today as the decline of the meme coin has accounted for 16%.
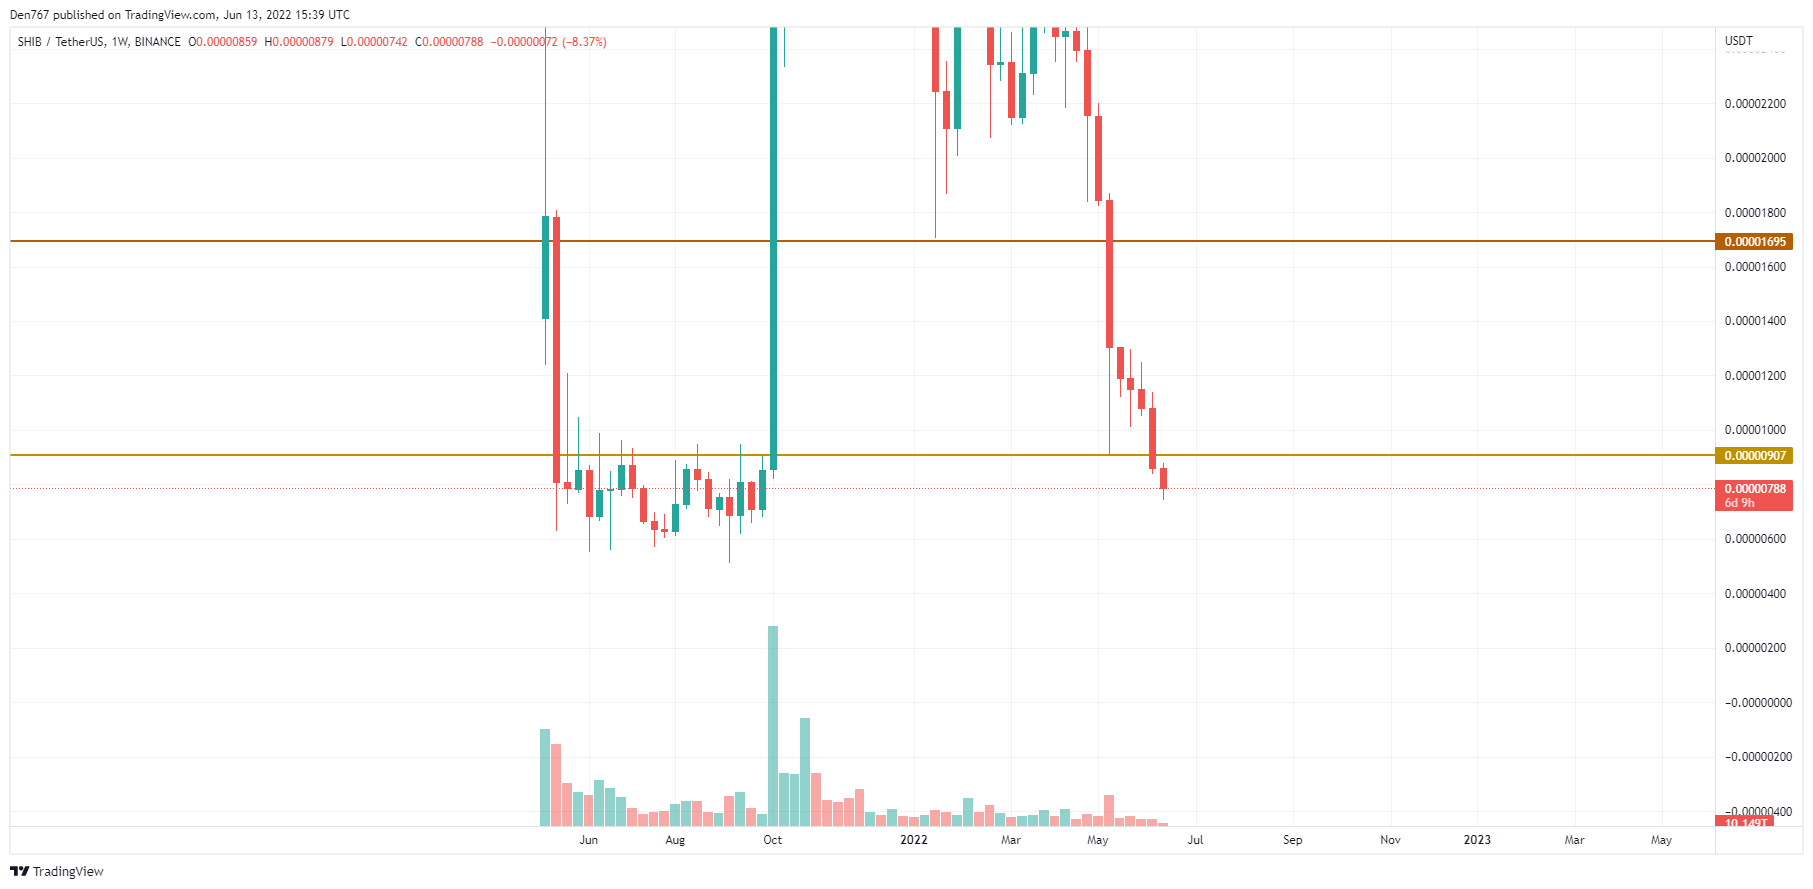
SHIB has broken its support level at $0.00000907 on the weekly time frame, confirming the buyers' weakness. From another point of view, the volume is low, which means that traders can expect at least a small bounce to the $0.00009 mark.
SHIB is trading at $0.0000078 at press time.
 Dan Burgin