*** Please note the analysis below is not investment advice. The views and opinions expressed here are solely those of the author and do not necessarily reflect the views of U.Today. Every investment and trading move involves risk, you should conduct your own research when making a decision.
Bitcoin possibly breakout opportunities
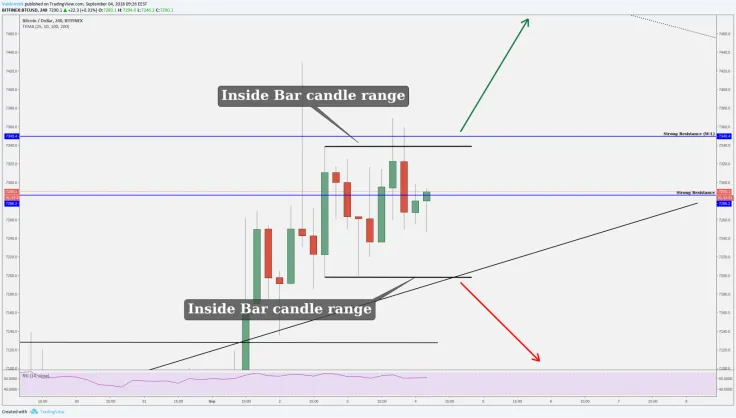
Currently, we are still between those two “resistance” lines (blue lines). To give you an indication where we might go then we have an “Inside bar” candlestick pattern (black lines from the wick).
We already have a higher close from this important candle but we need also a close above the wick, above the black line and if we get a close above $7,350 then we have two confirmations- breakout from the “Inside bar” main candle and break above the strong resistance levels.
If we lose the bullish momentum and we start to make a bigger pullback downwards then those confirmations are close below the Inside bar candle range ($7,200) and close below the trendline (black diagonal line).

If the market stays stable EOS may start to rally upwards!
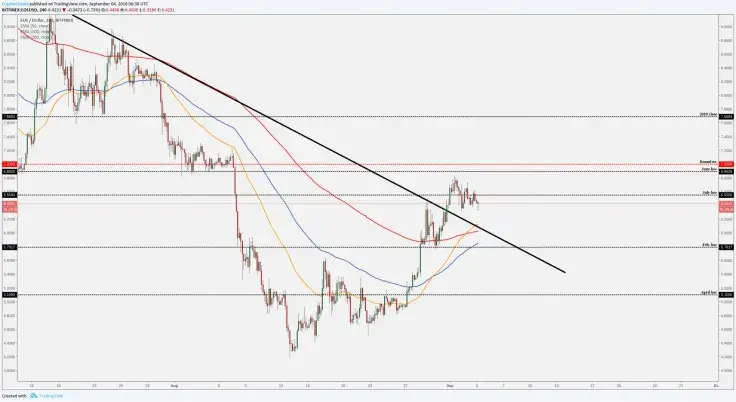
From the last month, we got a nice "Hammer" candlestick pattern (bullish pattern), bounce upwards was from $4 and the close was $6.4. Last week EOS made a little bit over 30 percent growth (open $4.9, close $6.6) and it made a break above the major down-trendline. Currently, the weekly chart shows us also a very positive sign, we have a "Morning Star" candlestick pattern which will indicate bullishness. If Bitcoin and the whole market stays stable then we could definitely see some rally upwards because, we have two strong candlestick patterns on the higher timeframes - super strong sign.

On the four-hour chart the current price is above the EMA's (50,100,200) but if we want to move upwards then we have to take down the July low which is around $6.5 and above the July low is also a very strong resistance what you need to watch: the round number $7 and there are also old supports which now becomes a resistance. So, above us, you have to watch two levels $6.5 and $7. If we take those levels down then we may go almost straight to $10 because 100 & 200 EMA are pointed upwards and ready to make a death cross.
Cardano (ADA)- steady climb upwards
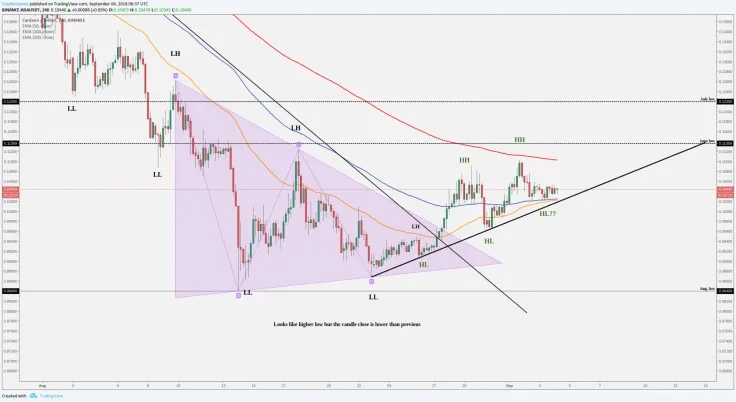
On the four-hour chart, Cardano shows us steady rise upwards. Now we have clean higher highs (HH) and higher lows (HL) which should be a positive sign. 50 and 100 EMA starting to cross which is also a good sign that the rise may continue if we see a bullish price action. Currently, the price is above the 50 and 100 EMA and above the round number $0.1. Those levels should start to work as a support.

If we drop a little bit lower than we could find a support from the minor trendline. So, if we find a support from this strong crossing area where EMA's, round number and the trendline meet each other and we start to go higher than our next resistance area is $0.113- there is the June low and possible higher high the road to the $0.113 could be a bit messy because we have to take down the 200 EMA on the four-hour chart.
Summary: Definitely EOS looks better than Cardano because Cardano, in the higher timeframes, doesn't look so bullish as EOS but at least ADA shows us some recovery with a steady grind upwards.
Hopefully, this helps you out a little bit to confirm your own analysis. Definitely, do your own research!
 Vladislav Sopov
 Dan Burgin