
Disclaimer: The opinions expressed by our writers are their own and do not represent the views of U.Today. The financial and market information provided on U.Today is intended for informational purposes only. U.Today is not liable for any financial losses incurred while trading cryptocurrencies. Conduct your own research by contacting financial experts before making any investment decisions. We believe that all content is accurate as of the date of publication, but certain offers mentioned may no longer be available.
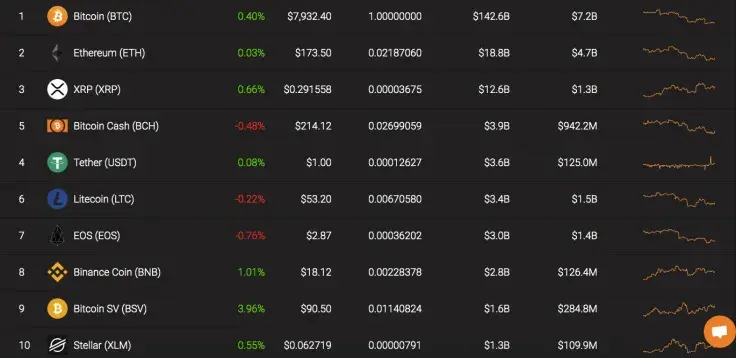
The cryptocurrency market remains in the bearish trend. The price of Bitcoin has reduced by almost 5% over the last week. Meanwhile, XRP is the only coin from the top 3, whose price is in the green zone and is showing a 6.49% rise compared to the previous week.
Meanwhile, Bitcoin is about to face the so-called “death cross” - the intersection of the 50-day moving average (MA) with the MA 200. Last time this intersection occurred in March last year against a bearish market.
Name: Bitcoin
Ticker: BTC
Market Cap: $143,400,315,818
Price: $7,966.50
Volume (24h): $14,645,166,791
Change (24h): 0.40%
The data is relevant at the press time.
BTC/USD: High Chances to Touch $7,500 Before Growth Revival
Our earlier Bitcoin price prediction came true as the price plummeted to $8,000 and even lower.
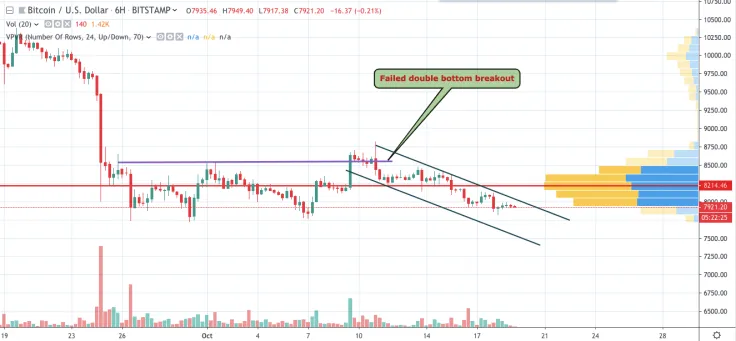
On the 6H chart, one could notice a failed Double bottom reversal pattern. Thus, the leading cryptocurrency has been in the deep bearish trend since October 11. According to these factors, no trend change is going to happen soon. Moreover, buyers are not interested in buying BTC back from the current levels due to the declining trading volume index.
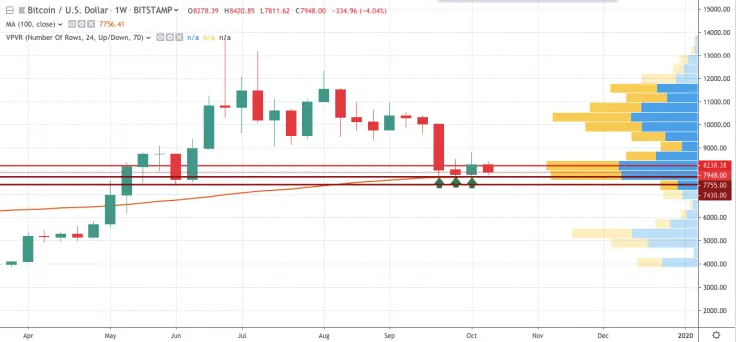
On the weekly timeframe, it is clear that Bitcoin has recently tested the MA 100 more than once. All this suggests that seller pressure is still very strong.

Consequently, the price may soon be at the 100-week MA ($7,755), and after that it may head for the $7,430 level, which corresponds to the marks of early June.
At press time, Bitcoin is trading at $7,943.
 Dan Burgin
 U.Today Editorial Team