
Disclaimer: The opinions expressed by our writers are their own and do not represent the views of U.Today. The financial and market information provided on U.Today is intended for informational purposes only. U.Today is not liable for any financial losses incurred while trading cryptocurrencies. Conduct your own research by contacting financial experts before making any investment decisions. We believe that all content is accurate as of the date of publication, but certain offers mentioned may no longer be available.
On Oct. 23, the price of Bitcoin, the first cryptocurrency bymmarket cap, fell below the $ 7,500 mark, thereby updating the five-month low.
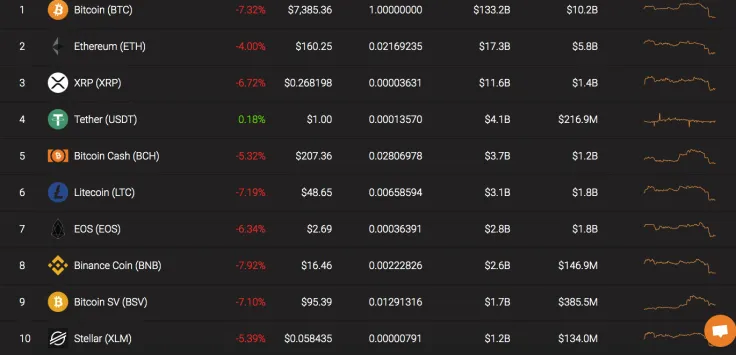
BTC hasn't seen this price level since mid-May. All other top assets simply followed the decline of BTC. Binance Coin is the top loser based on its eight percent price drop.
After four attempts at testing the $7,800 support, the expected breakdown of this area eventually occurred. The BTC price reached the level of $7,400-$7,500, and the decline continued.
Name: Bitcoin
Ticker: BTC
Market Cap: $134 525 021 938
Price: $7 469,34
Volume (24h): $22 000 911 540
Change (24h): -7,33%
The data is relevant at the press time.
BTC/USD: Has Bitcoin Bottomed Out?
The leading crypto followed our yesterday price prediction Bitcoin is unlikely to trade above $8,000 until the end of October.
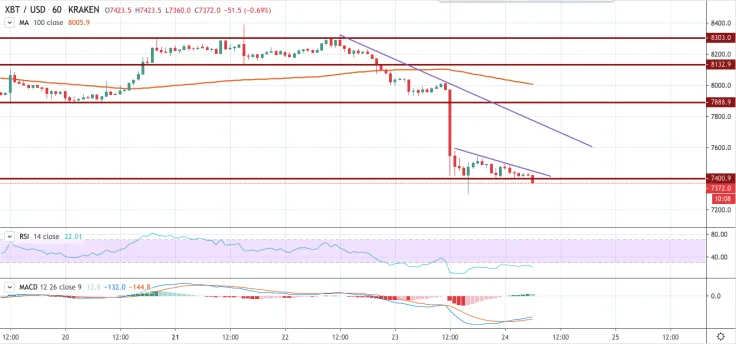
On the chart of the BTC / USD pair, two connecting bearish trend lines with a resistance at about $7,450 and $7,660 dollars have been formed.

If a break occurs upward above the resistance of $6,660, the price may recover to the resistance levels of $7,800 and $7,880 (previous support).
On the other hand, the level of $7,380 is immediate support. If a break occurs below the
$7,380 area, the price may return to the support zone of $7,300. Any further losses are likely to open up the possibility of a push from the strong support levels of $7,200 and $7,120.
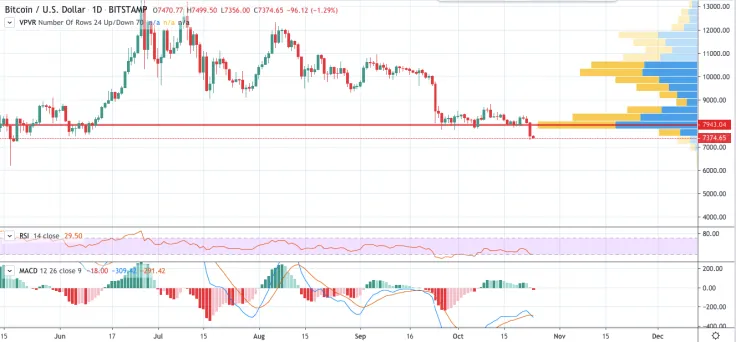
On the daily chart, Bitcoin is below the trend line and large volume according to VPVR. The RSI has not crossed the oversold area yet which might indicate the decline to $7,200. Moreover, yesterday price drop has switched the MACD to the bearish trend.
Summing up, Bitcoin is unlikely to show a trend change soon. The price might show a revival, followed by a further drop.
Bitcoin is trading at $7,414 at press time.
 Dan Burgin
 U.Today Editorial Team