Disclaimer: The opinions expressed by our writers are their own and do not represent the views of U.Today. The financial and market information provided on U.Today is intended for informational purposes only. U.Today is not liable for any financial losses incurred while trading cryptocurrencies. Conduct your own research by contacting financial experts before making any investment decisions. We believe that all content is accurate as of the date of publication, but certain offers mentioned may no longer be available.
Bitcoin has not been showing any significant price changes over the last days. Its rate has increased by only 1.29% over the last 7 days. If yesterday XRP was the top gainer out of the top coins, today, its place has been replaced by Stellar. The price of XLM has risen by more than 4% over the last day.
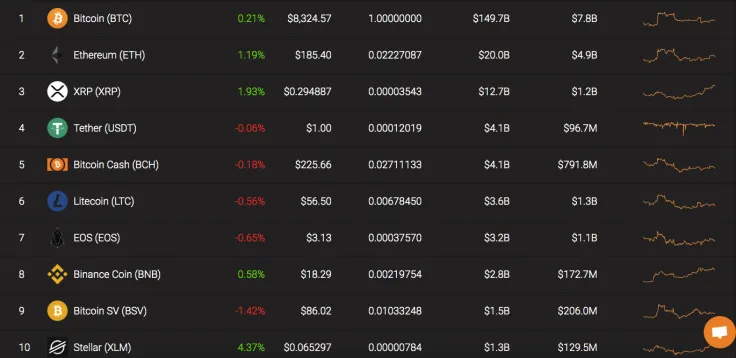
At the same time, altcoins are becoming more attractive to traders which are reflected in the dominance of Bitcoin. The market share of the leading crypto has declined by around 1% over the last month and now constitutes 65.96%.
Name: Bitcoin
Ticker: BTC
Market Cap: $150 595 030 002
Price: $8 369,70
Volume (24h): $15 017 724 532
Change (24h): 0,21%
The data is relevant at the press time.
BTC/USD: Bears are Stronger than Bulls in a Short-Term
Our yesterday price forecast is coming true as Bitcoin remains moving within the range between $8,100 and $8,300.
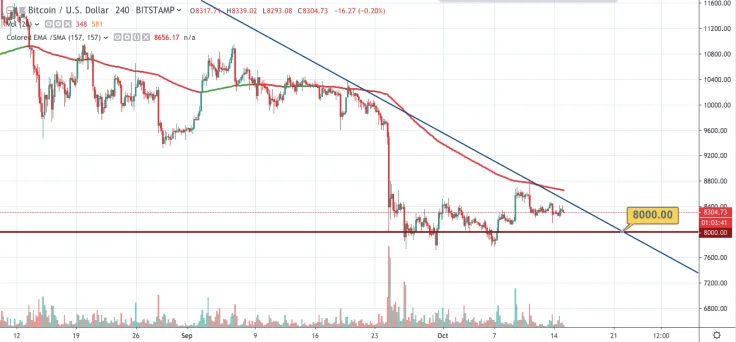
On the 4H chart, Bitcoin is under the Colored EMA/SMA line, meaning that the rate might go down from the current levels. What is more, bulls could not manage to break the bearish line, which indicates the upcoming drop. In this regard, the nearest level which Bitcoin is about to reach soon is the crucial point at $8,000.
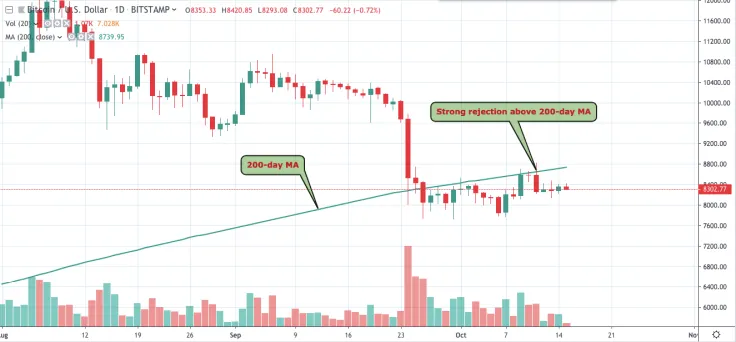
On the bigger time frame, the focus is on the 200-day moving average (MA), often perceived as a kind of boundary between the bullish and bearish markets.

The chart above shows that since the end of September, the price has repeatedly tried to break through the MA 200 but without a result. This suggests weak customer pressure and that shortly the prospects for sharp growth are unreal.
Bitcoin is trading at $8,303 at press time.
 Dan Burgin
 U.Today Editorial Team