
Disclaimer: The opinions expressed by our writers are their own and do not represent the views of U.Today. The financial and market information provided on U.Today is intended for informational purposes only. U.Today is not liable for any financial losses incurred while trading cryptocurrencies. Conduct your own research by contacting financial experts before making any investment decisions. We believe that all content is accurate as of the date of publication, but certain offers mentioned may no longer be available.
The rates of most of the coins are coming back to the red zone, according to CoinStats.
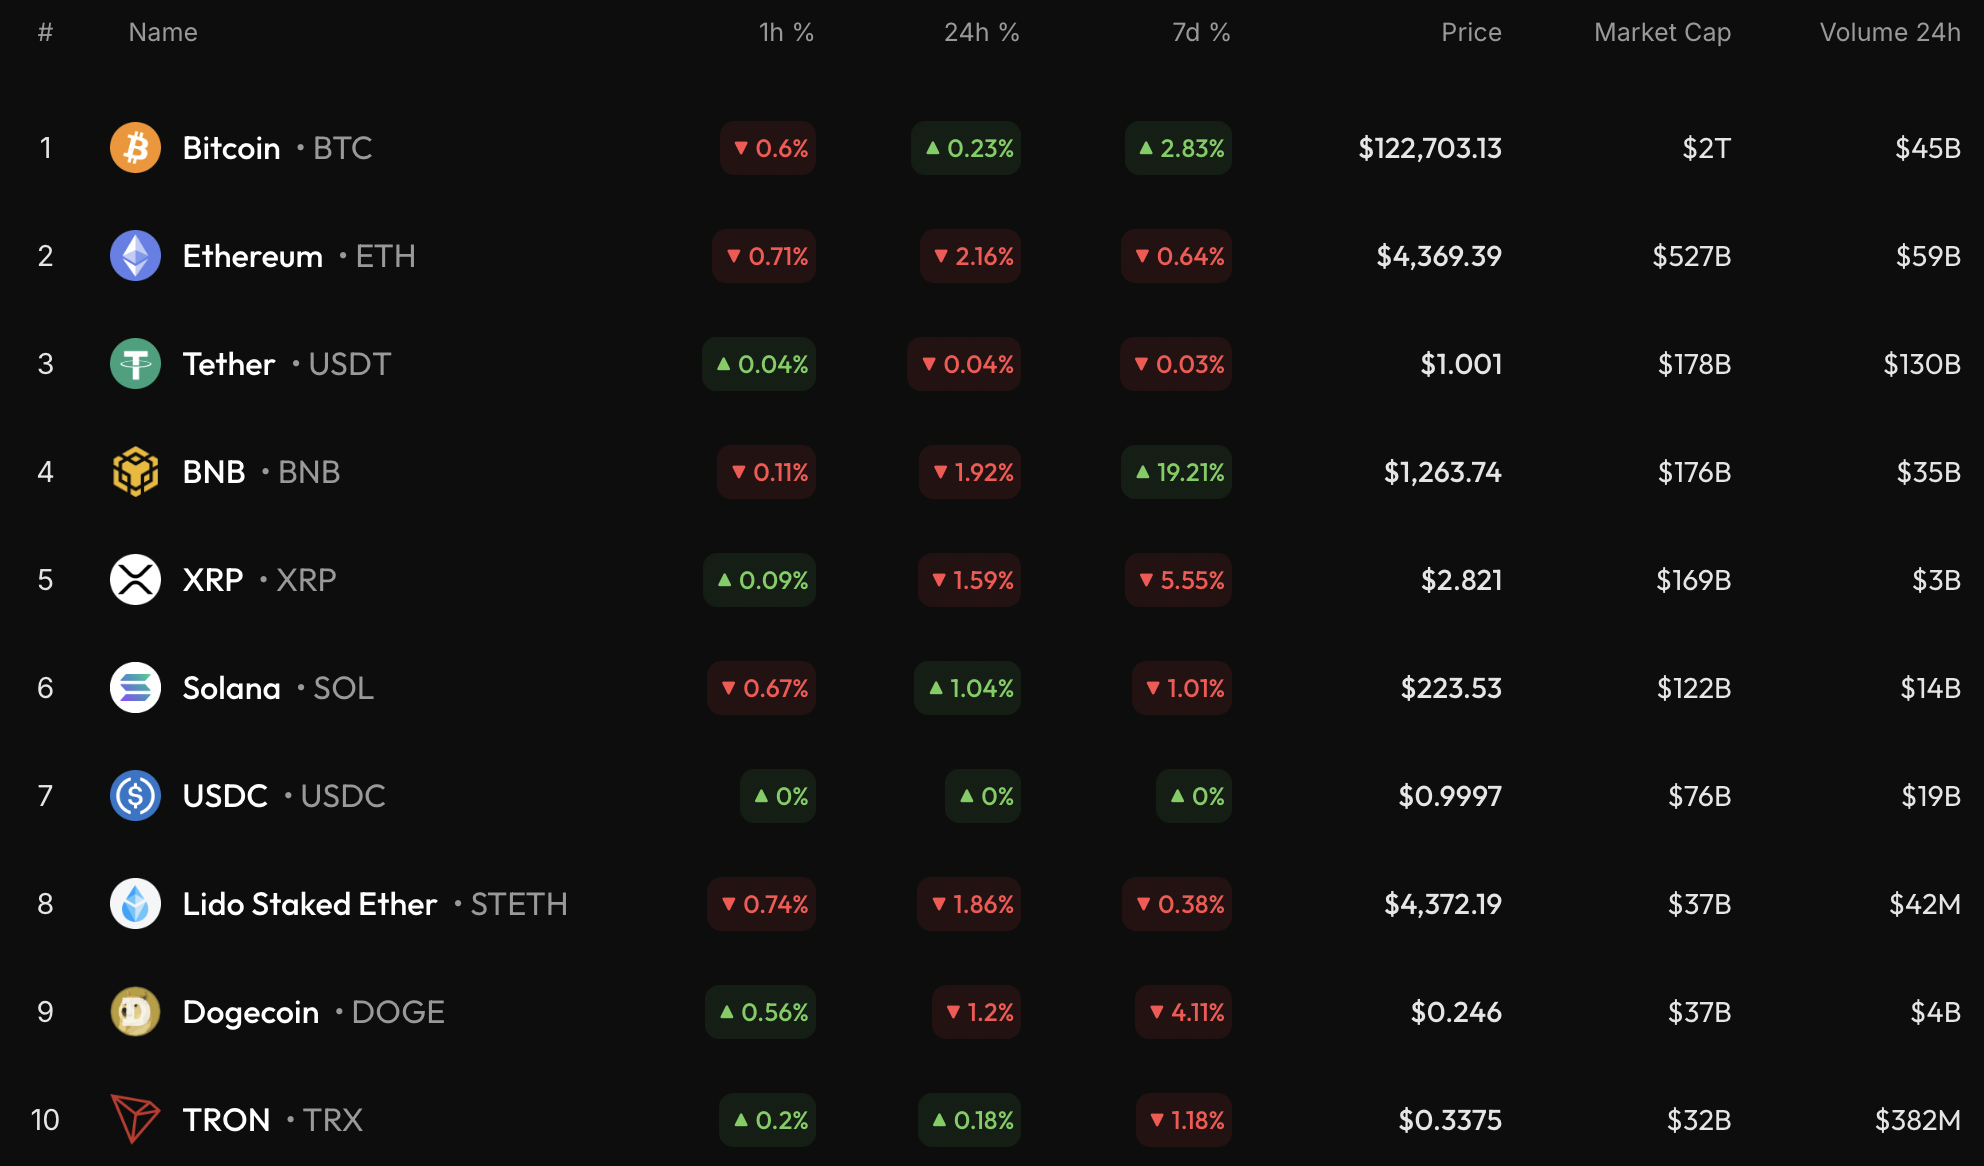
BTC/USD
Unlike other coins, the price of Bitcoin (BTC) has risen by 0.23% over the last day.
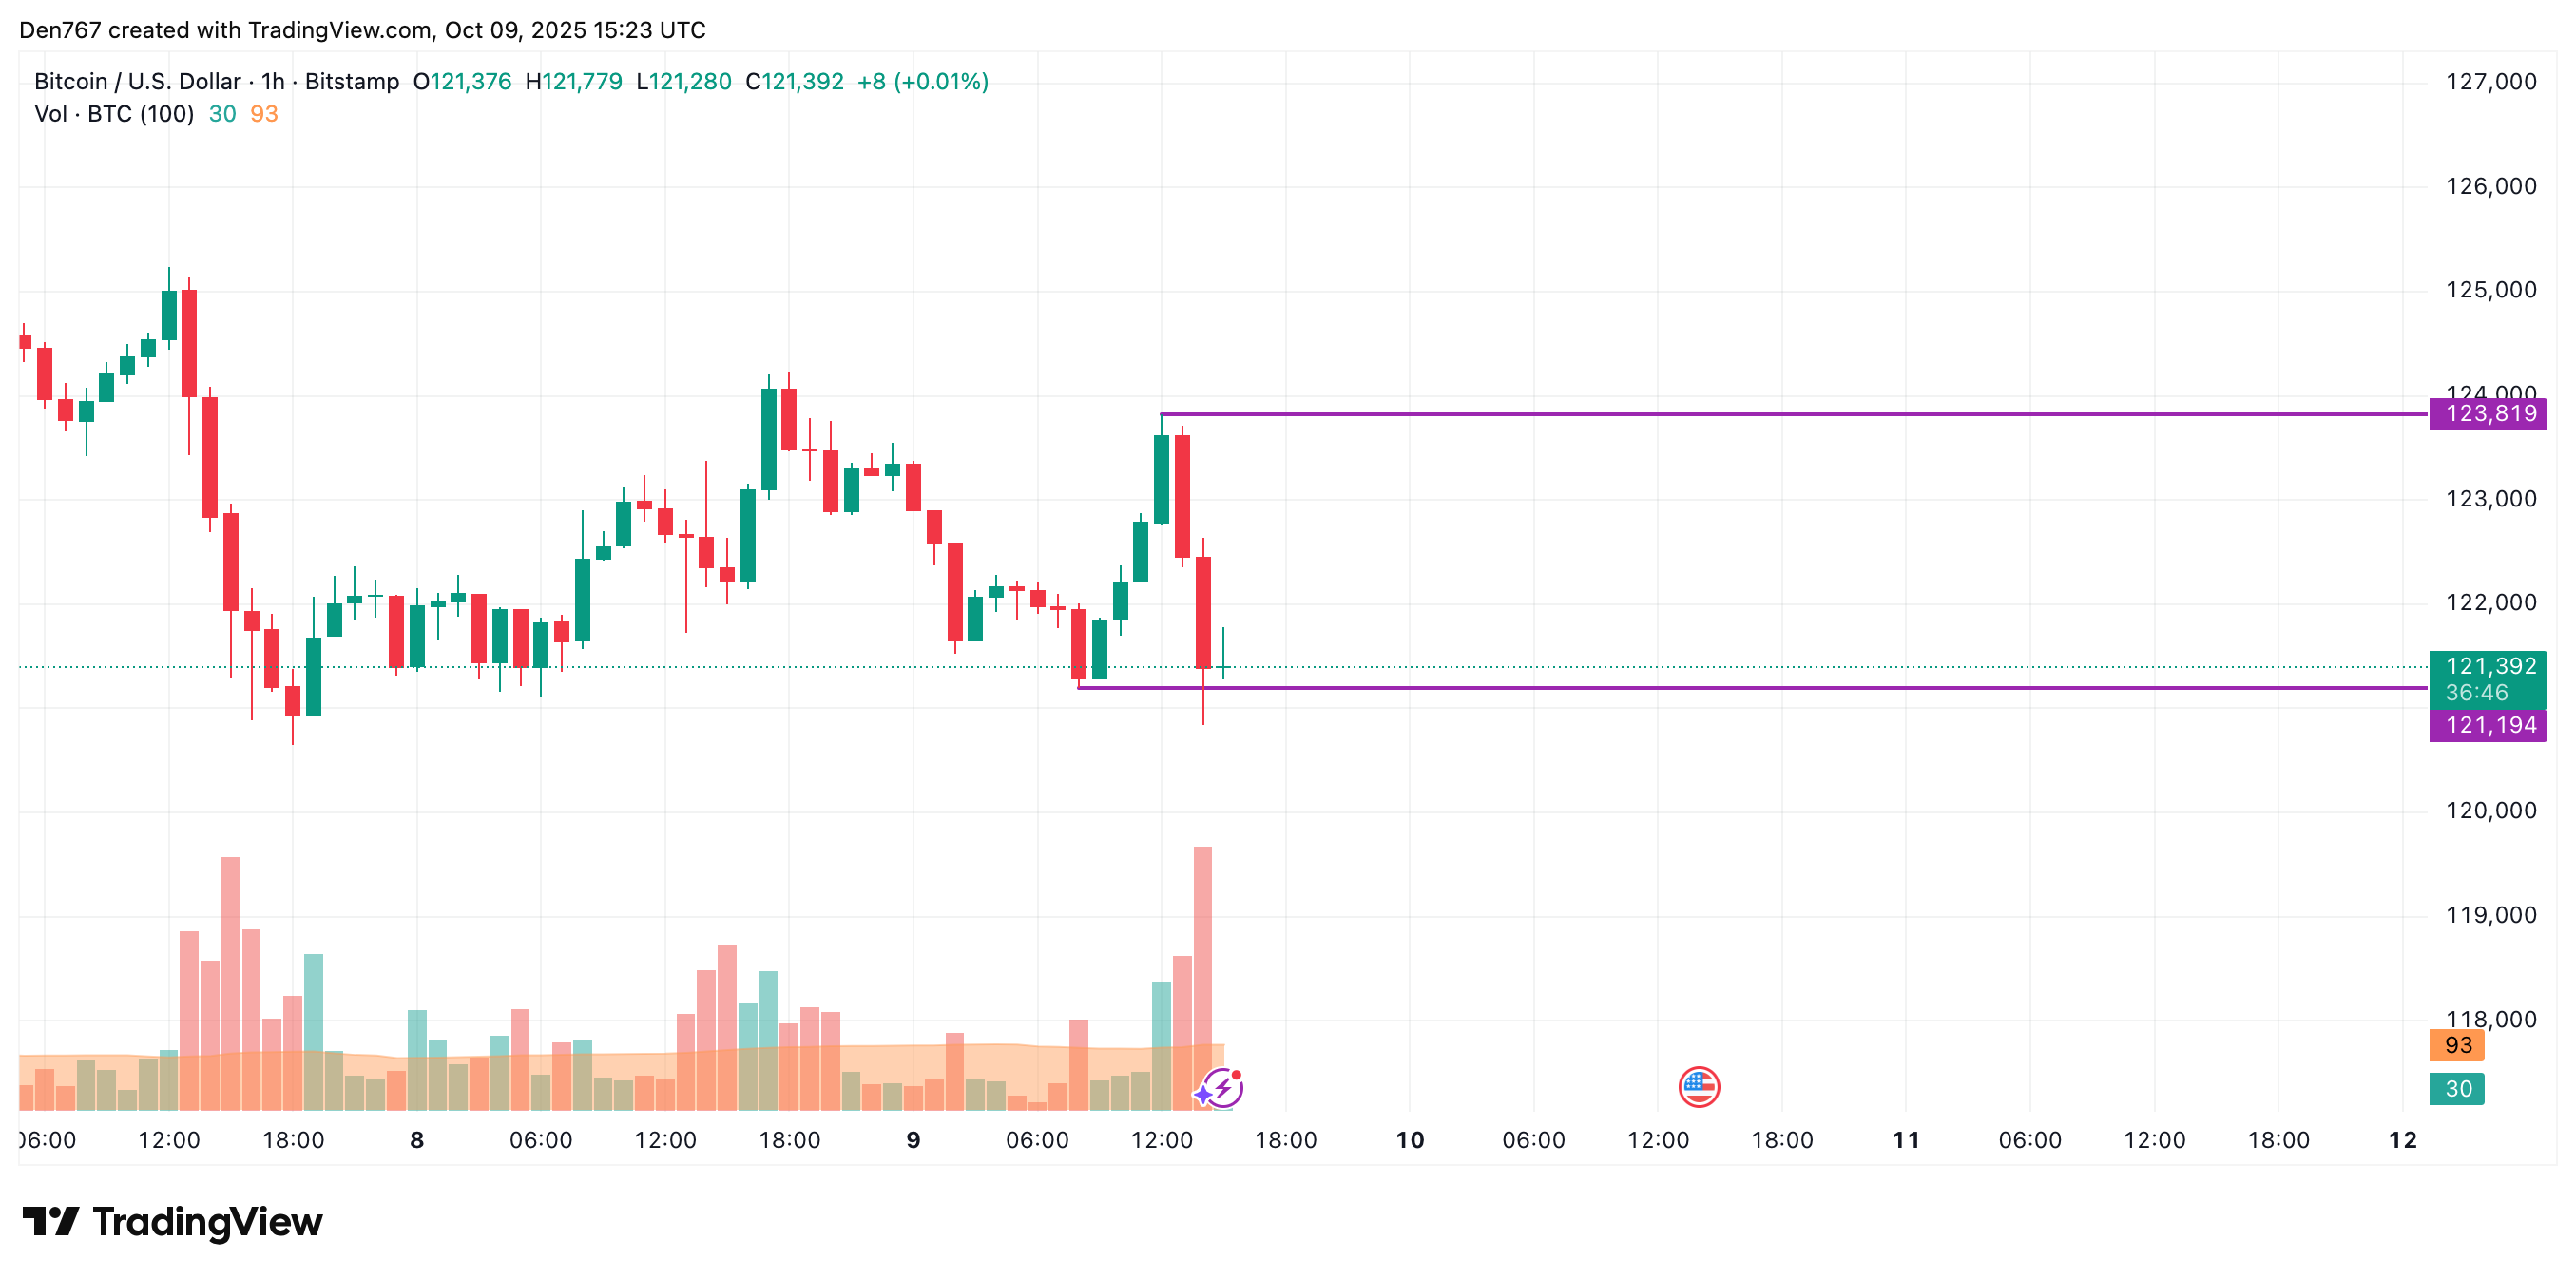
Despite today's growth, the rate of BTC is looking bearish on the hourly chart. If a breakout of the local support happens, the fall is likely to continue to the $120,000 area.
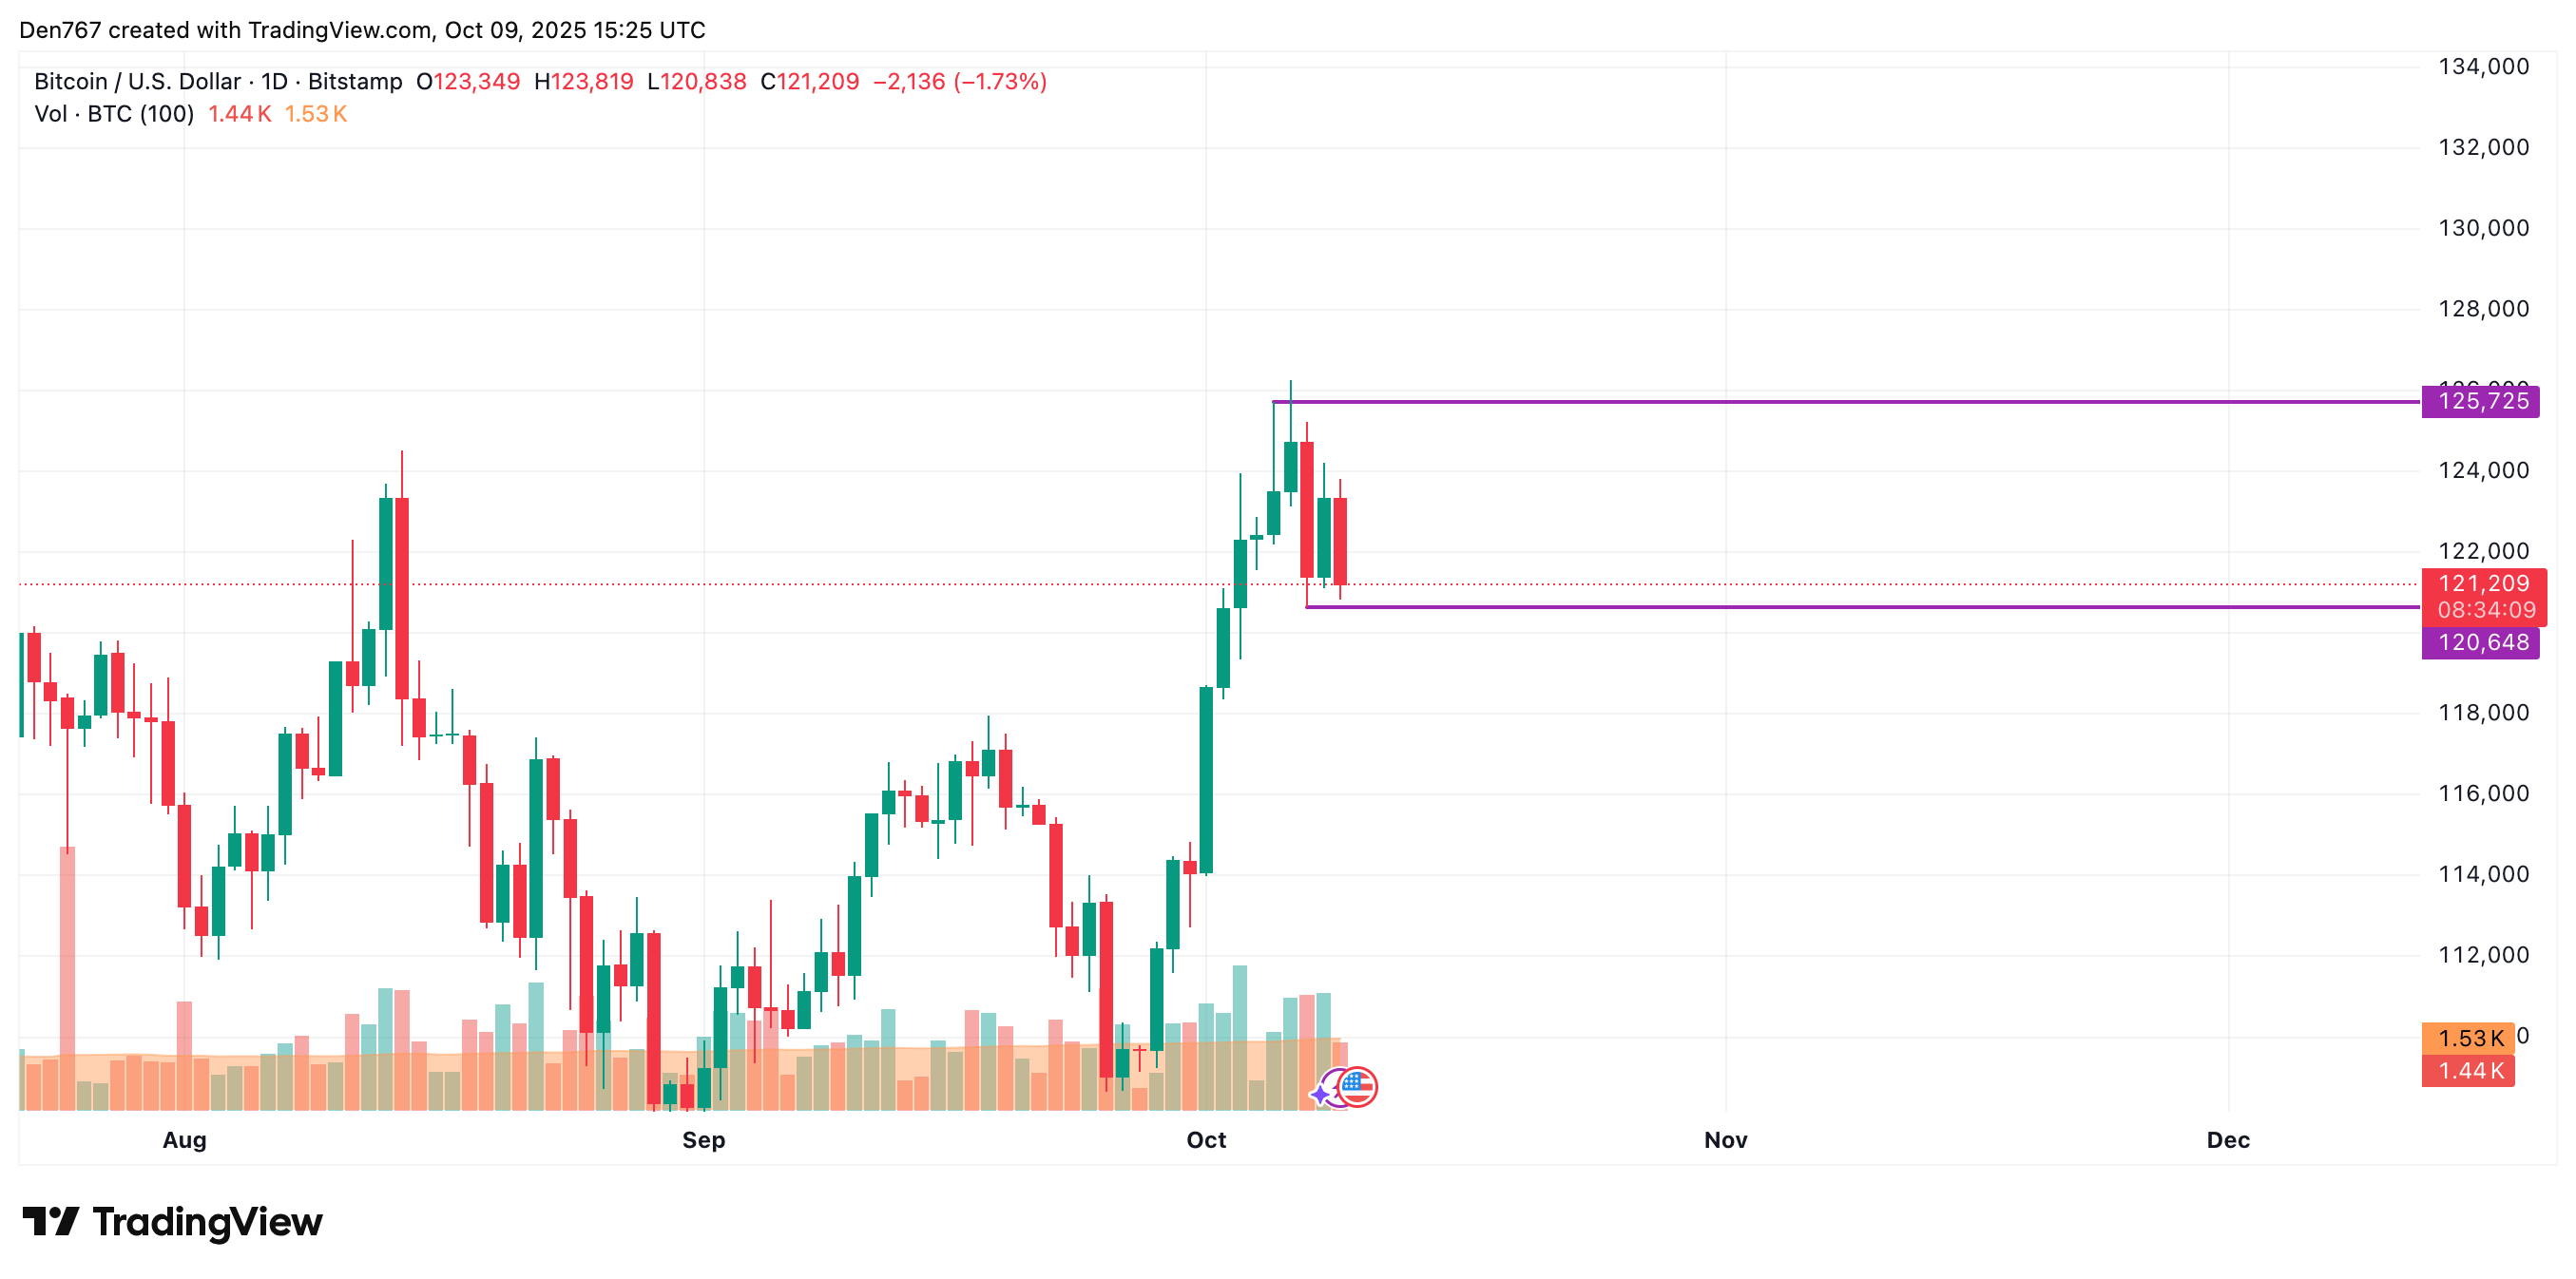
On the longer time frame, buyers have failed to keep the rise going after yesterday's bullish closure.

If the daily bar closes around the current prices or below them, sellers may seize the initiative, which may lead to a test of the $118,000-$119,000 range.
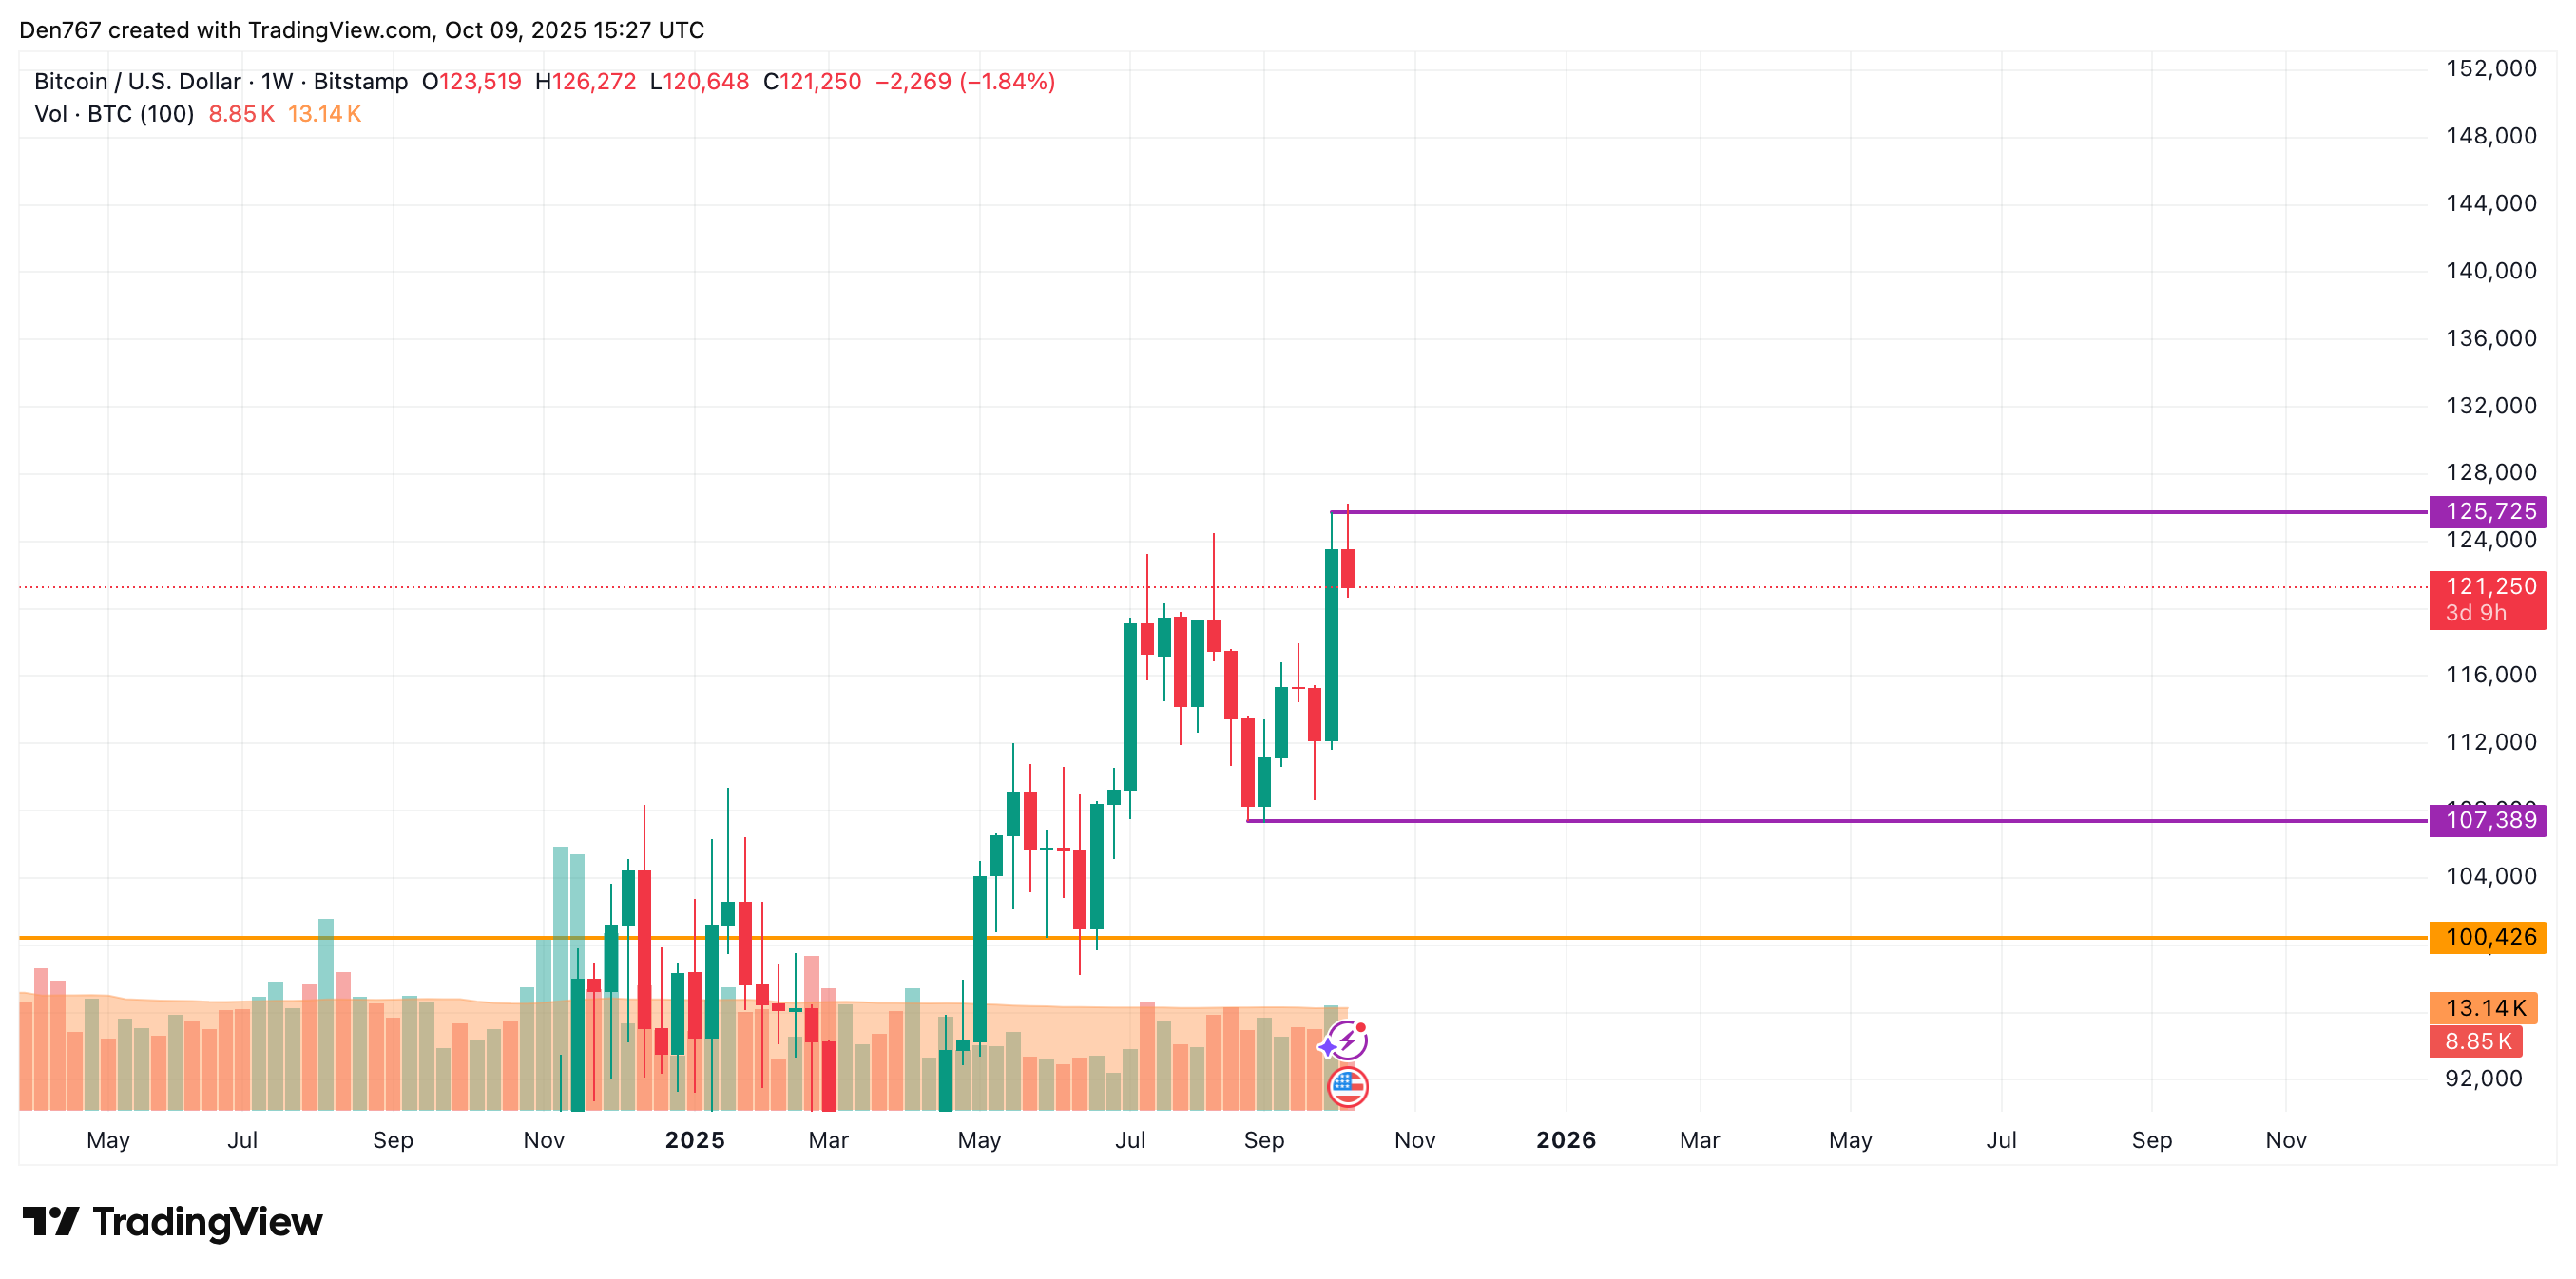
From the midterm point of view, the rate of BTC has marked a false breakout of the $125,725 level. If the weekly bar closes far from that mark, the drop may continue to the $118,000 zone.
Bitcoin is trading at $121,250 at press time.
 Dan Burgin
 U.Today Editorial Team