
Disclaimer: The opinions expressed by our writers are their own and do not represent the views of U.Today. The financial and market information provided on U.Today is intended for informational purposes only. U.Today is not liable for any financial losses incurred while trading cryptocurrencies. Conduct your own research by contacting financial experts before making any investment decisions. We believe that all content is accurate as of the date of publication, but certain offers mentioned may no longer be available.
Sunday is mostly under bears' control, according to CoinStats.
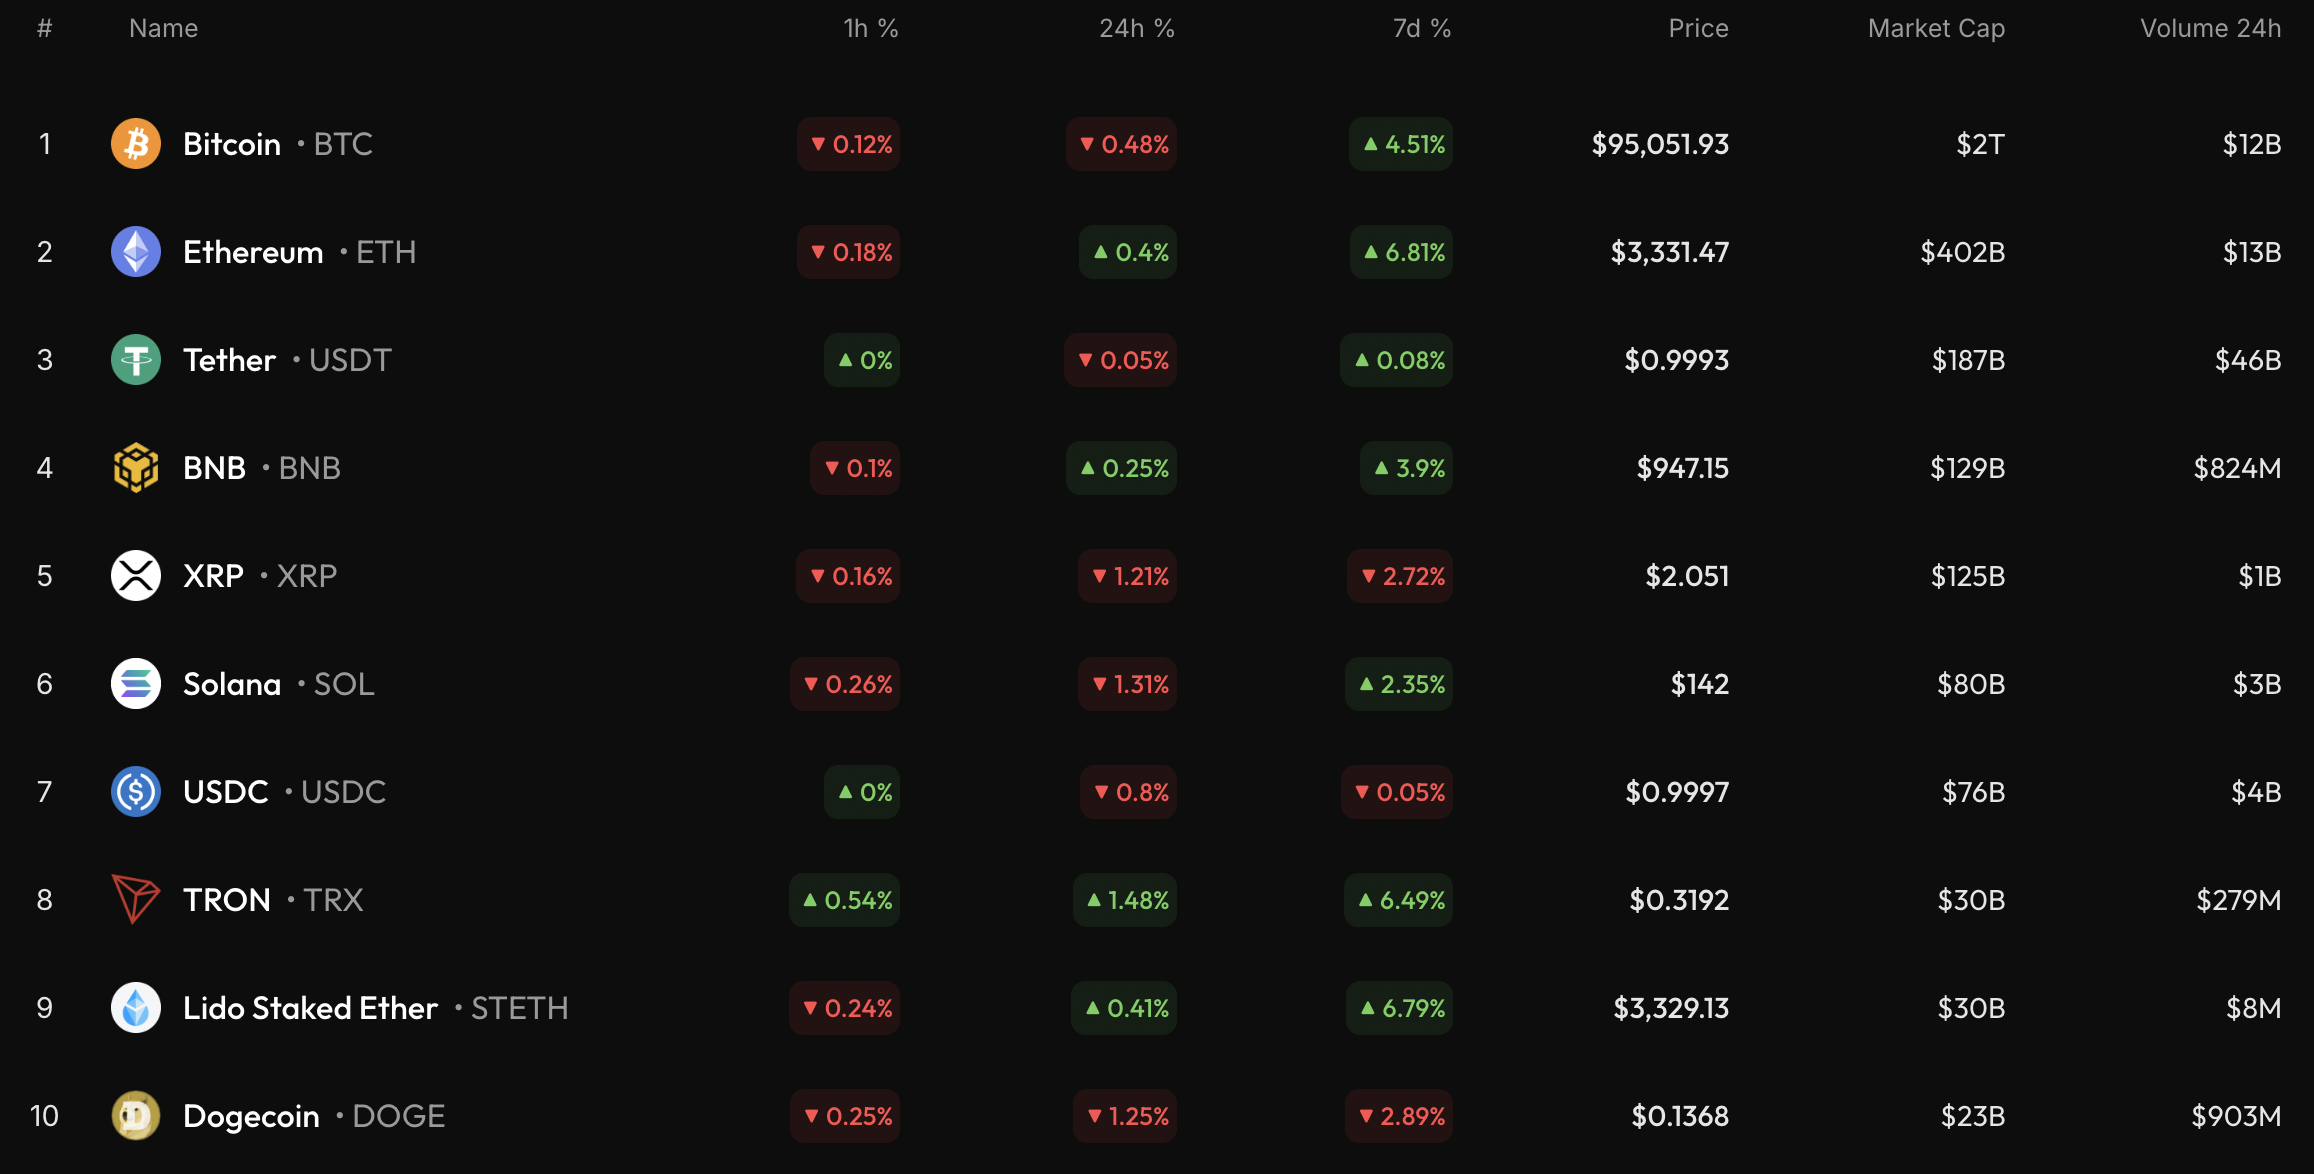
BTC/USD
The rate of Bitcoin (BTC) has declined by 0.48% since yesterday. Over the last week, the price has risen by 4.51%.
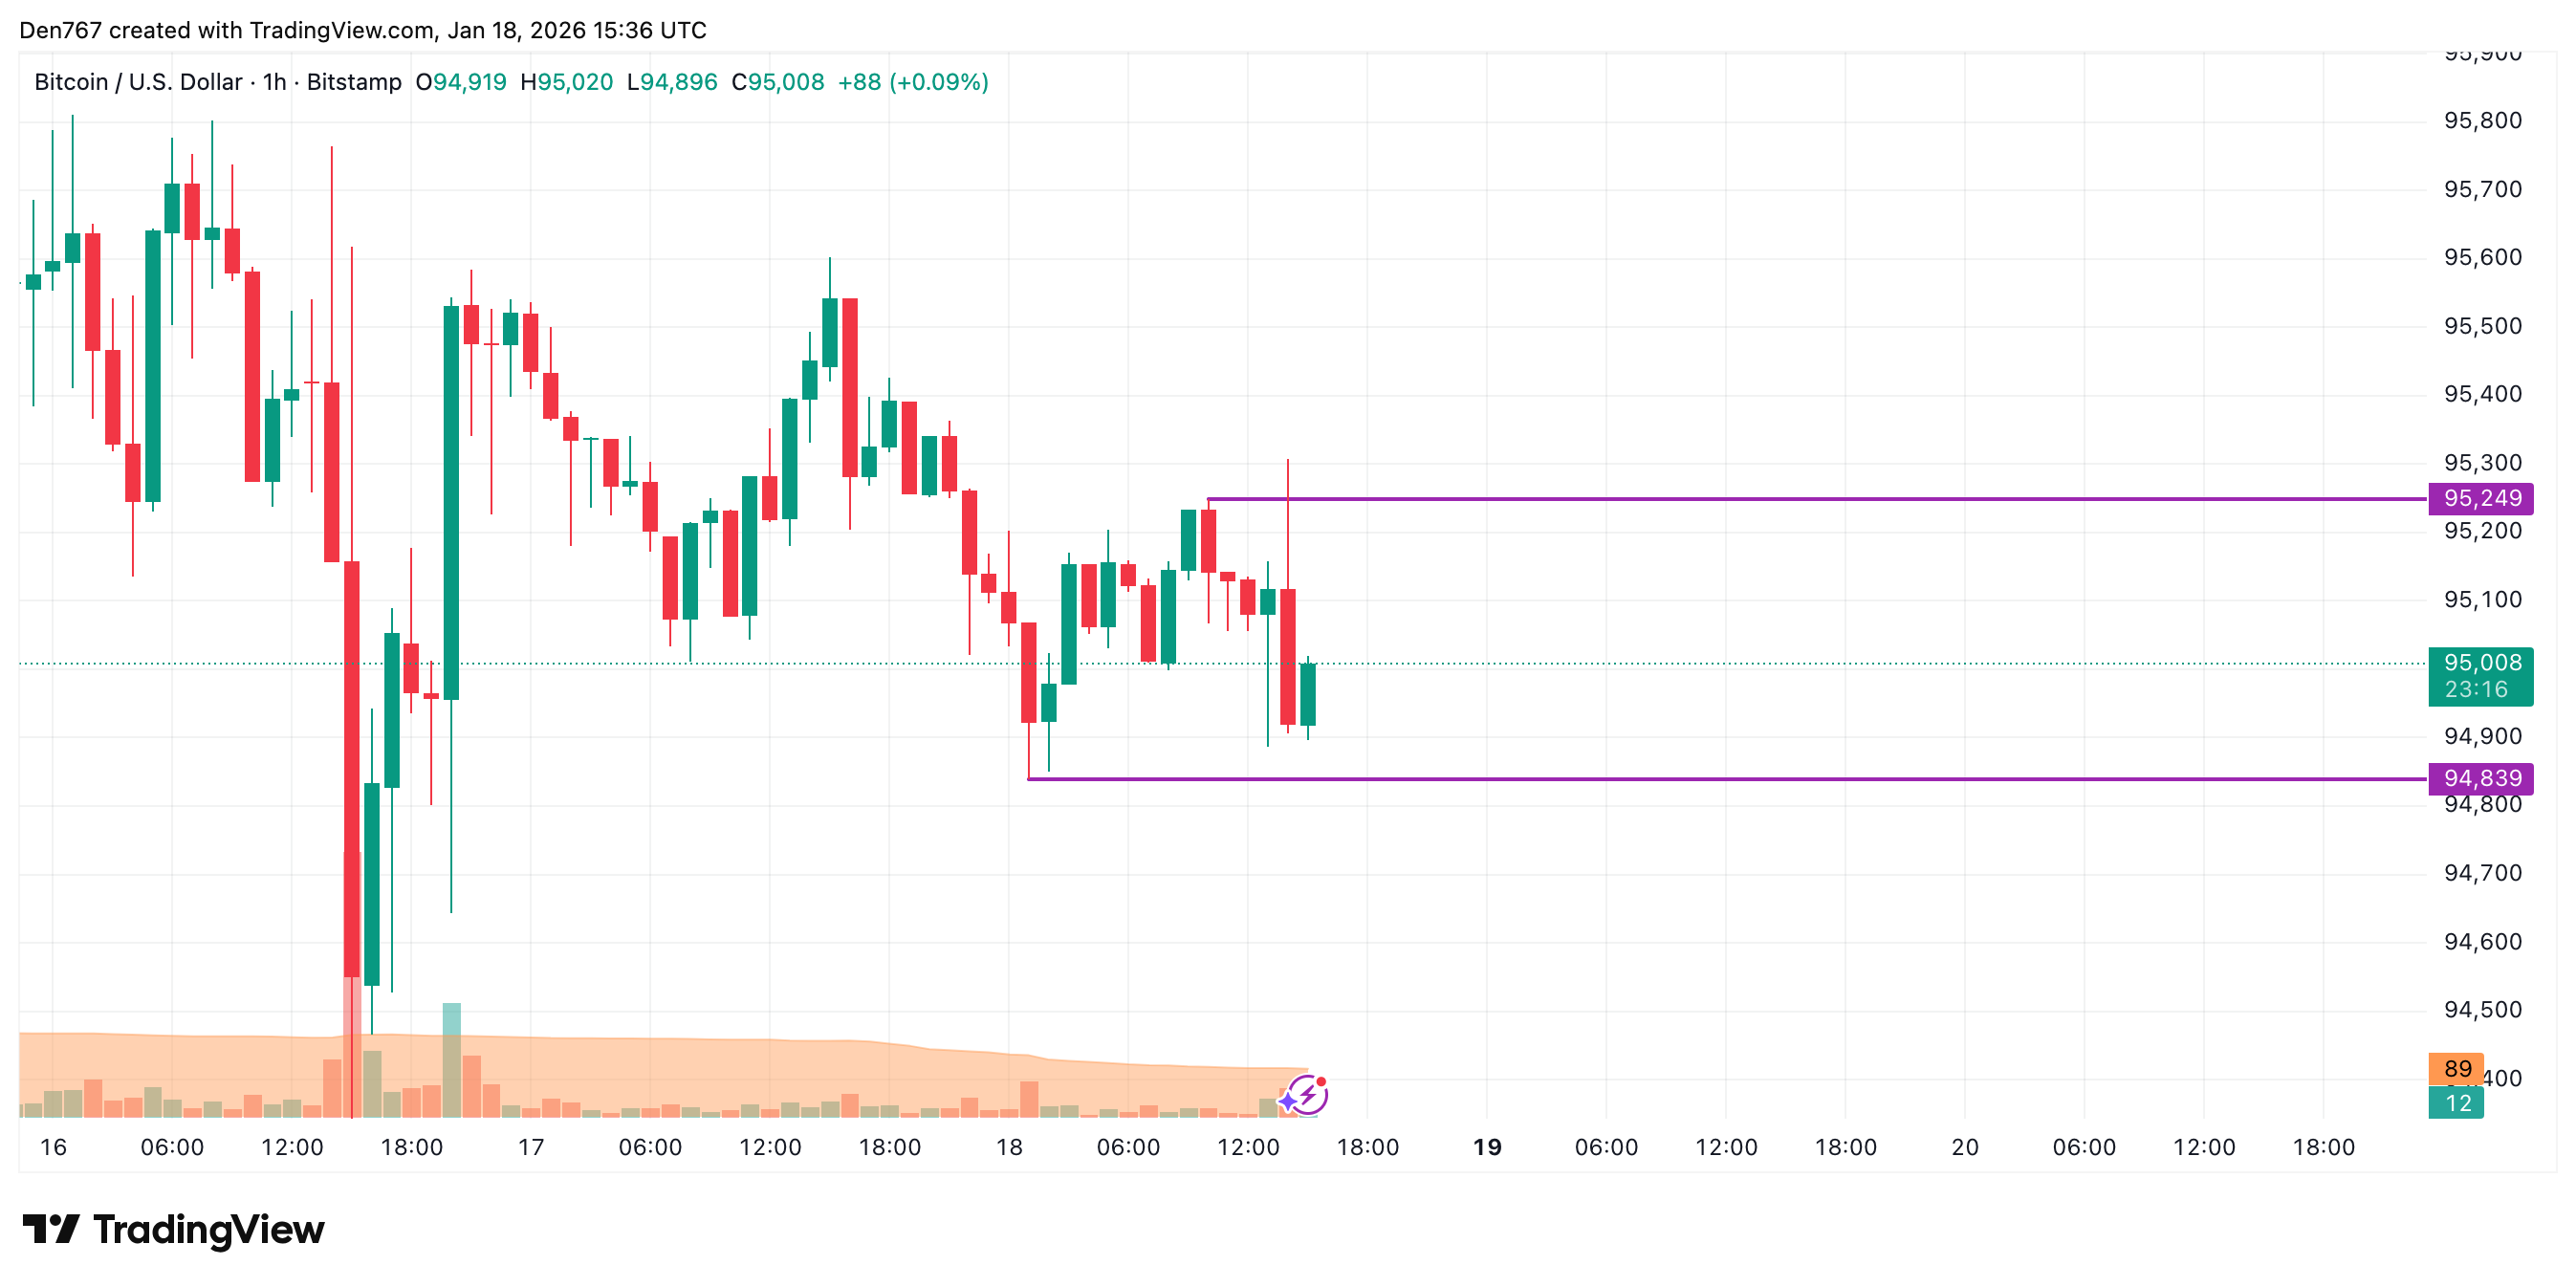
On the hourly chart, the price of BTC has made a false breakout of the local resistance at $95,249.

If the daily bar closes near the support, traders may see a test of the $94,500 range shortly.
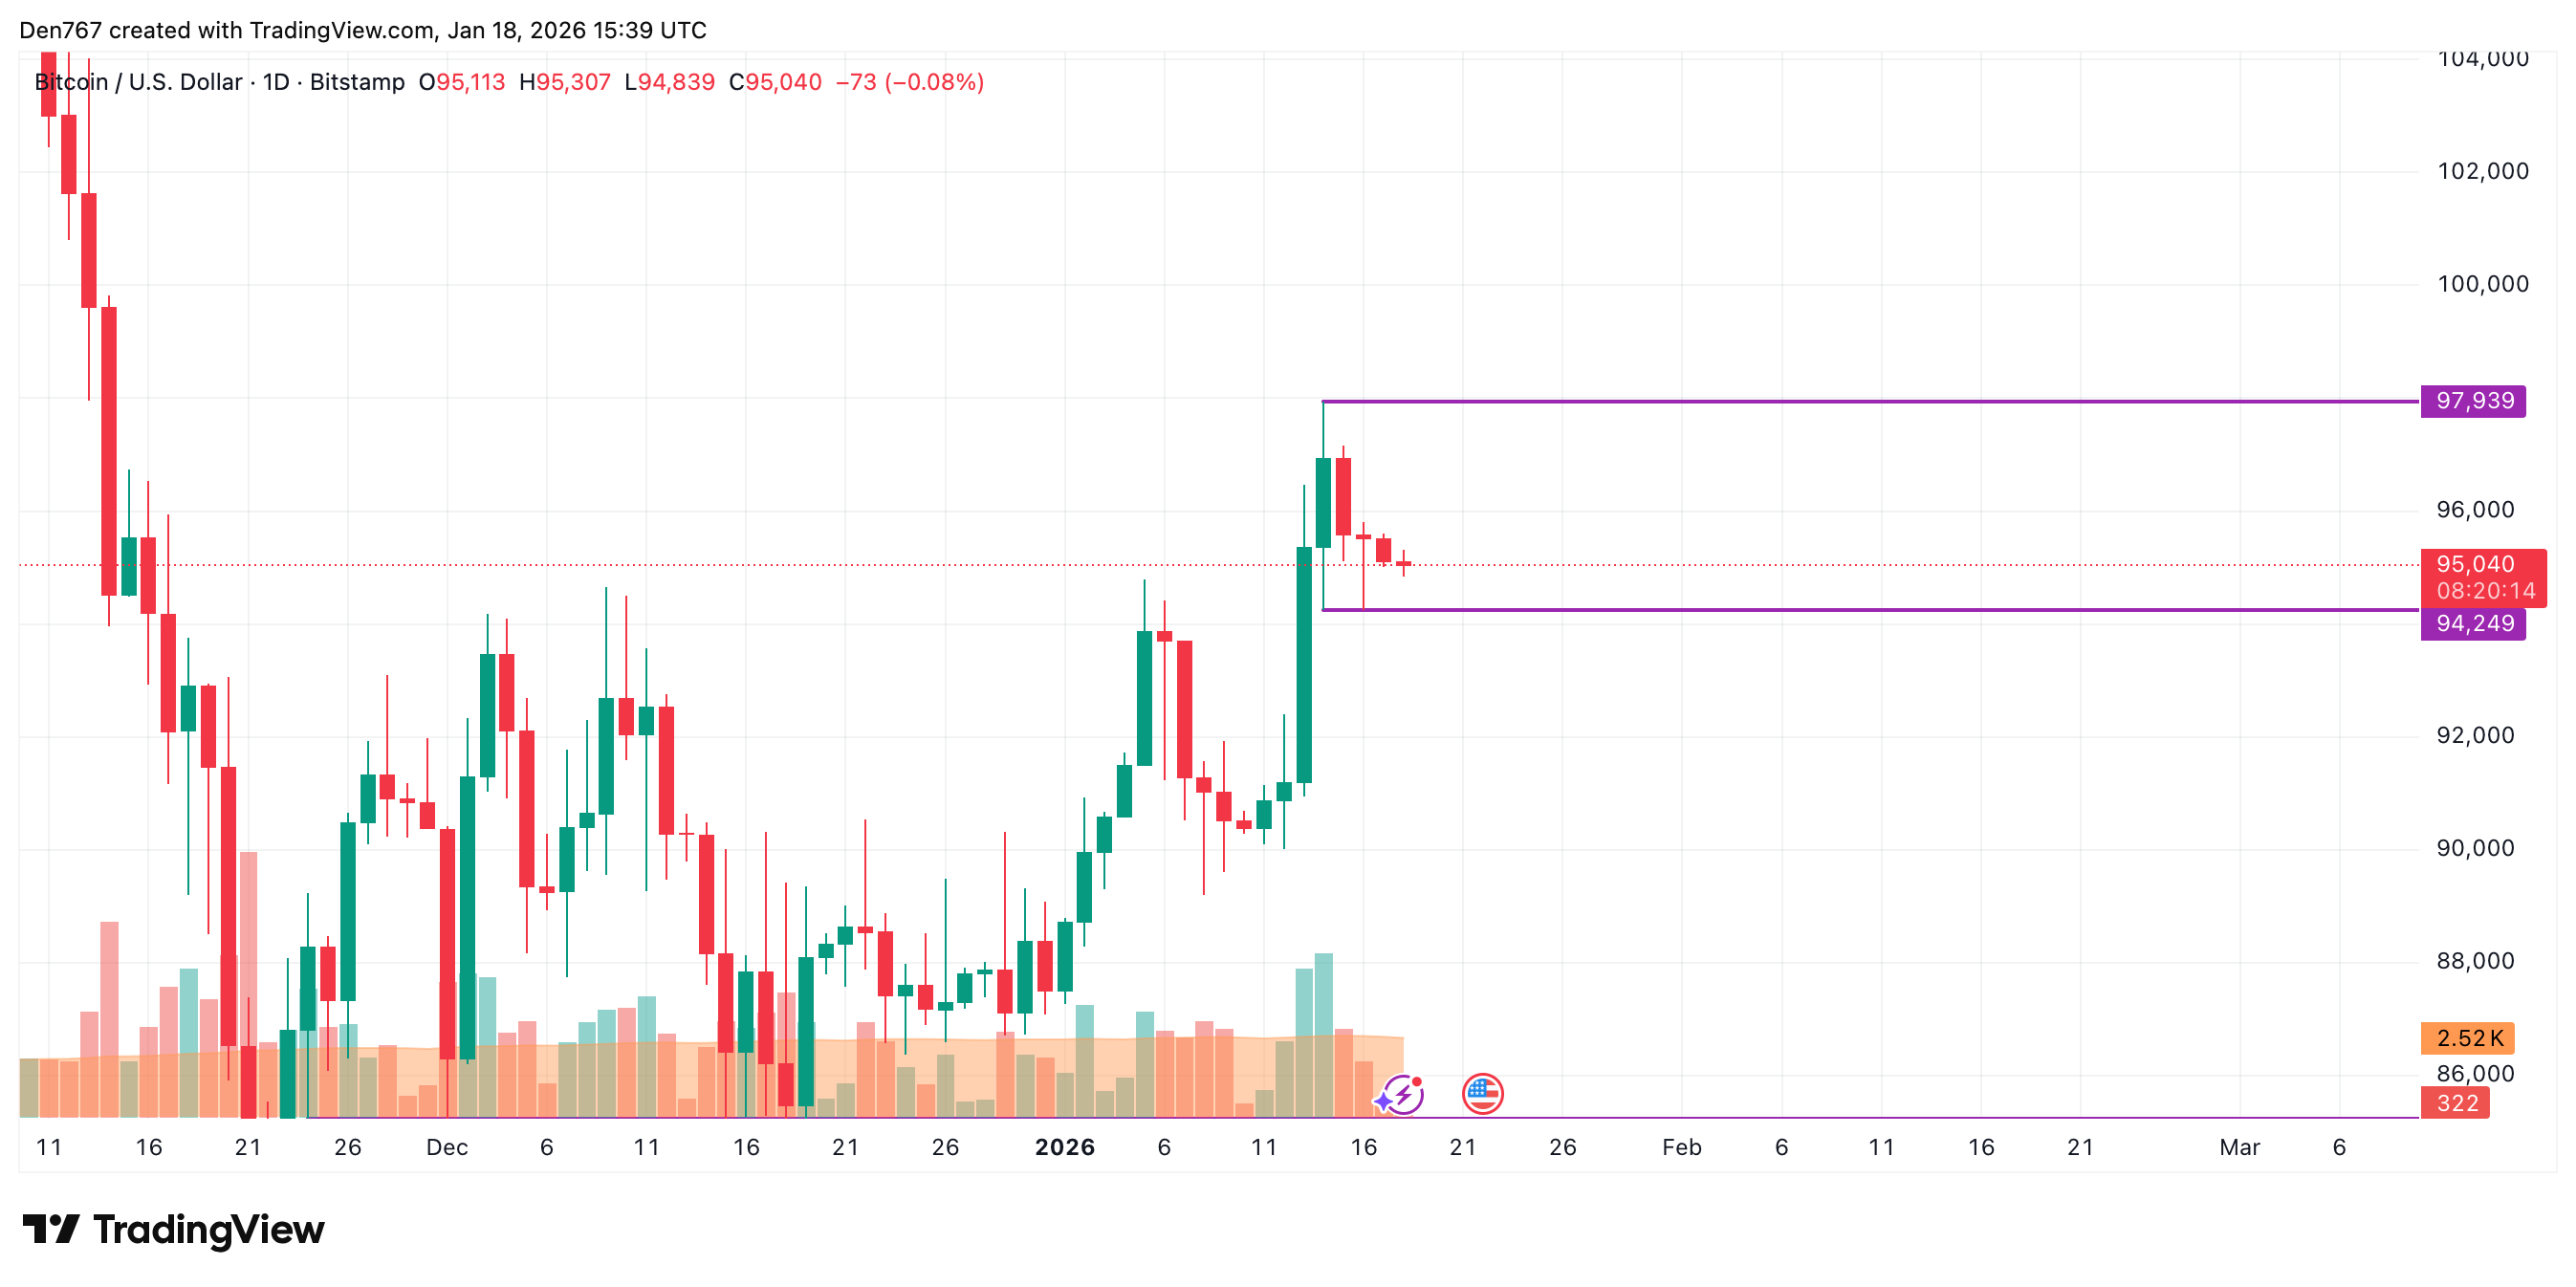
On the bigger time frame, the rate of the main crypto is closer to the support than to the resistance. If a breakout of the $94,249 level happens, the accumulated energy might be enough for an ongoing decline to the $92,000-$94,000 range.
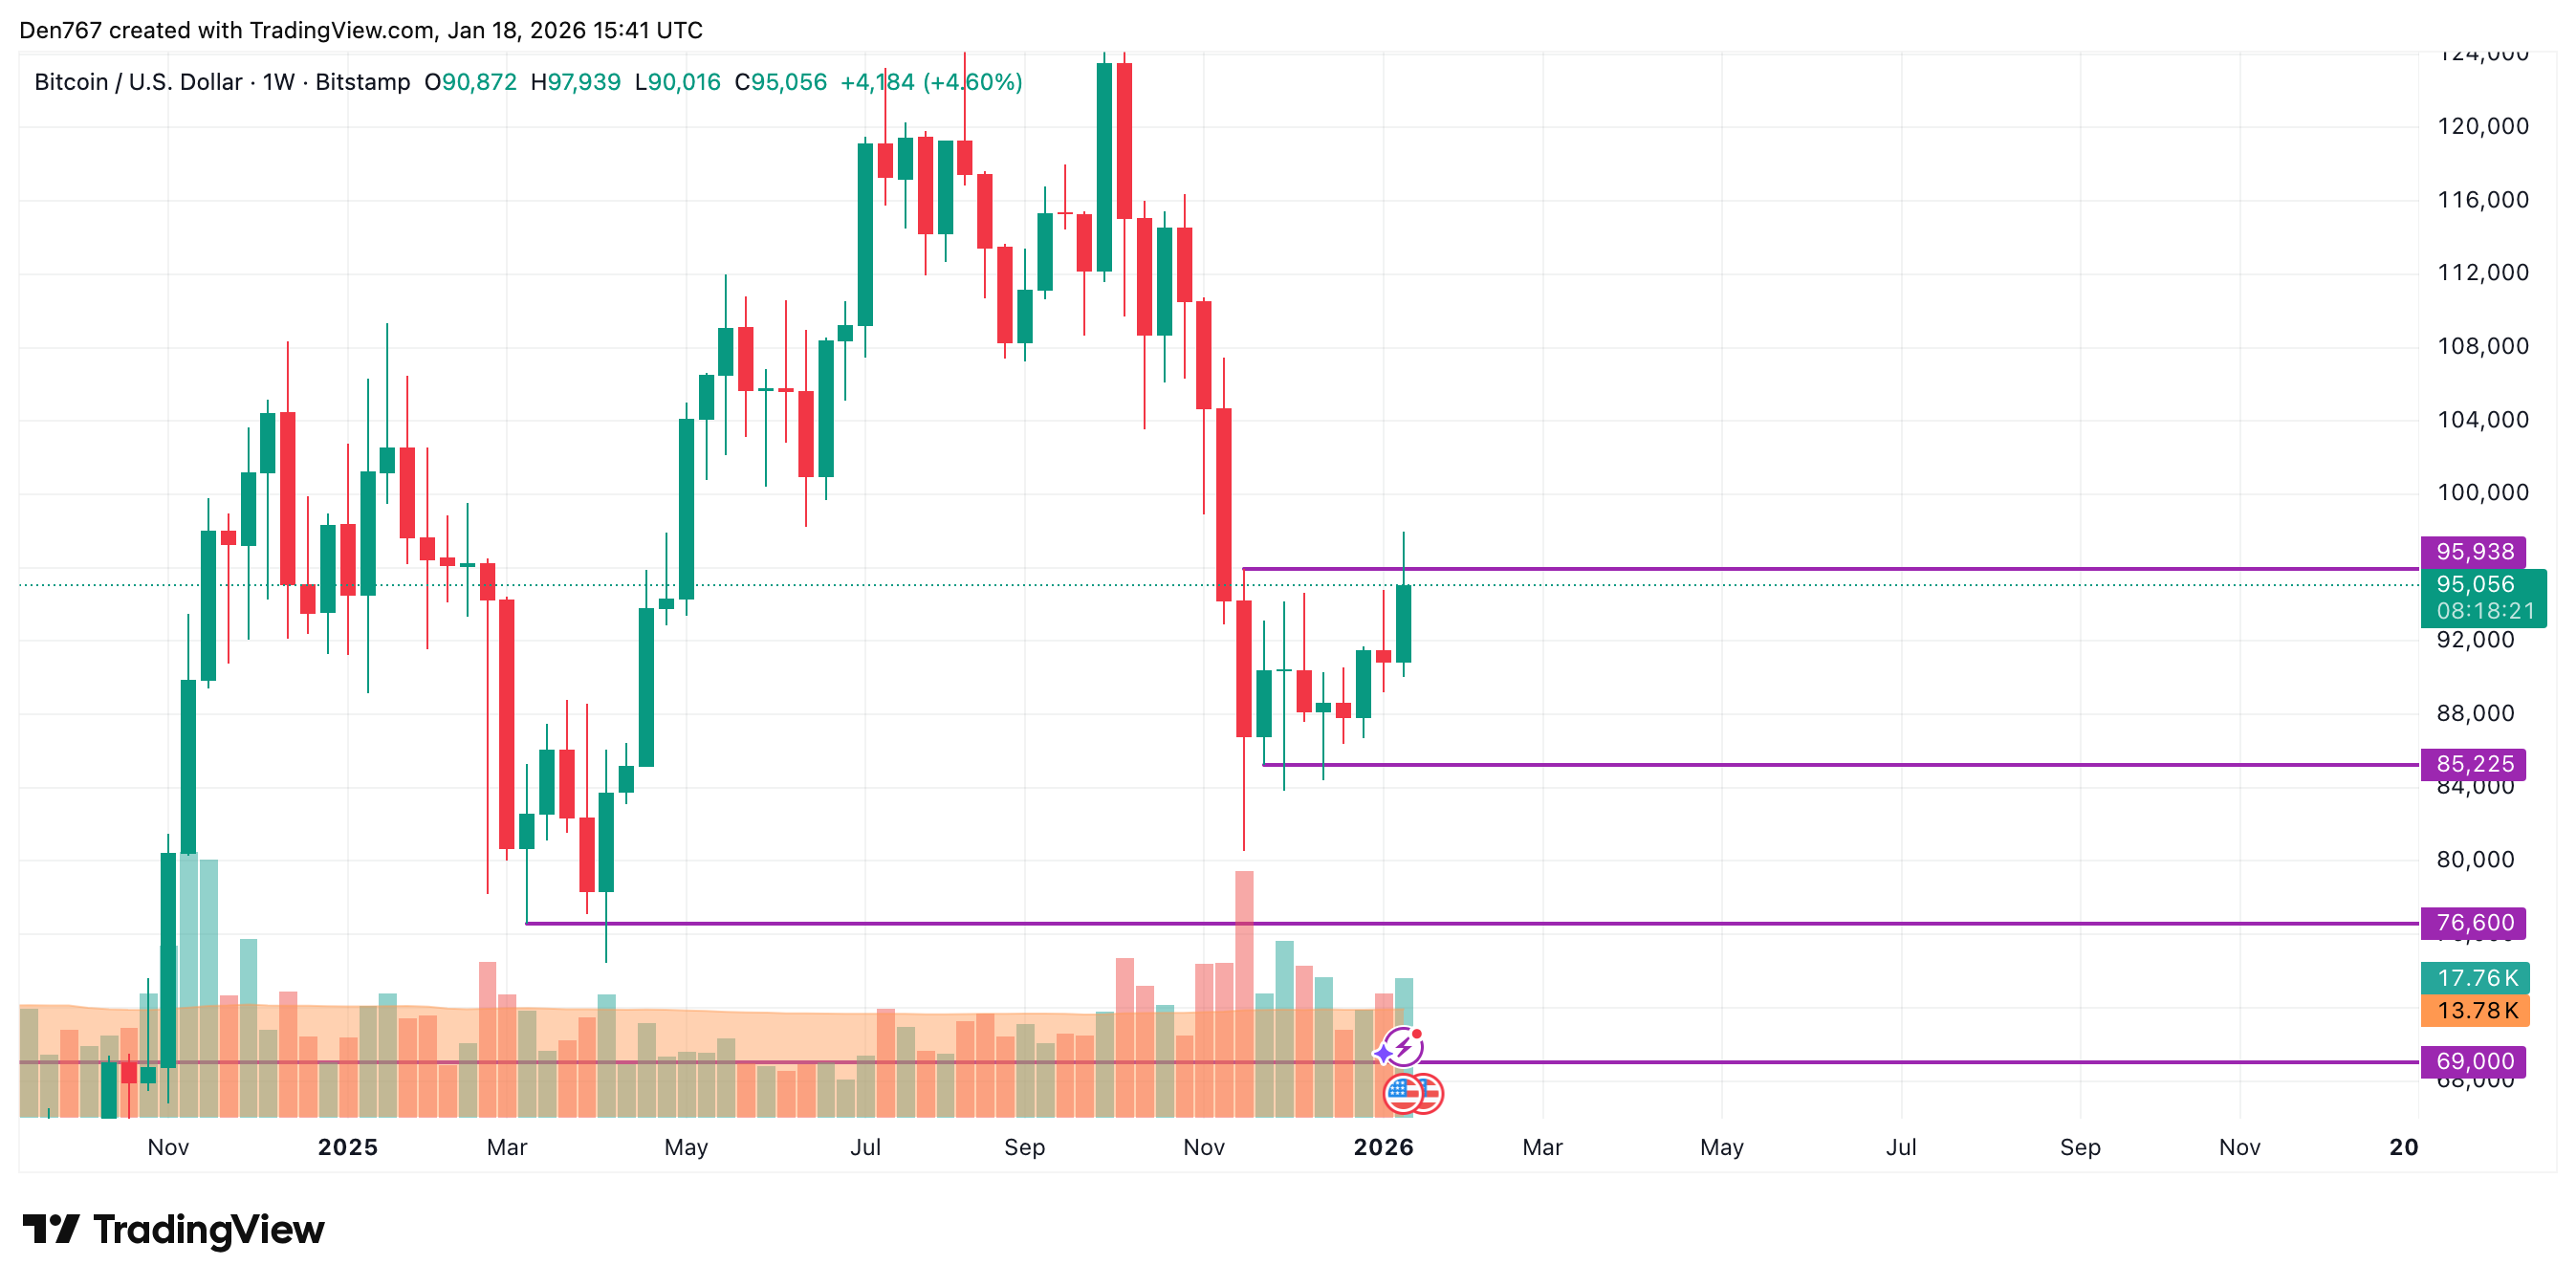
From the midterm point of view, traders should focus on the weekly bar closure in terms of the $95,938 level. If it happens far from it, sellers may seize the initiative, which may lead to a drop to the $92,000 area.
Bitcoin is trading at $95,056 at press time.
 Dan Burgin
 U.Today Editorial Team