Disclaimer: The opinions expressed by our writers are their own and do not represent the views of U.Today. The financial and market information provided on U.Today is intended for informational purposes only. U.Today is not liable for any financial losses incurred while trading cryptocurrencies. Conduct your own research by contacting financial experts before making any investment decisions. We believe that all content is accurate as of the date of publication, but certain offers mentioned may no longer be available.
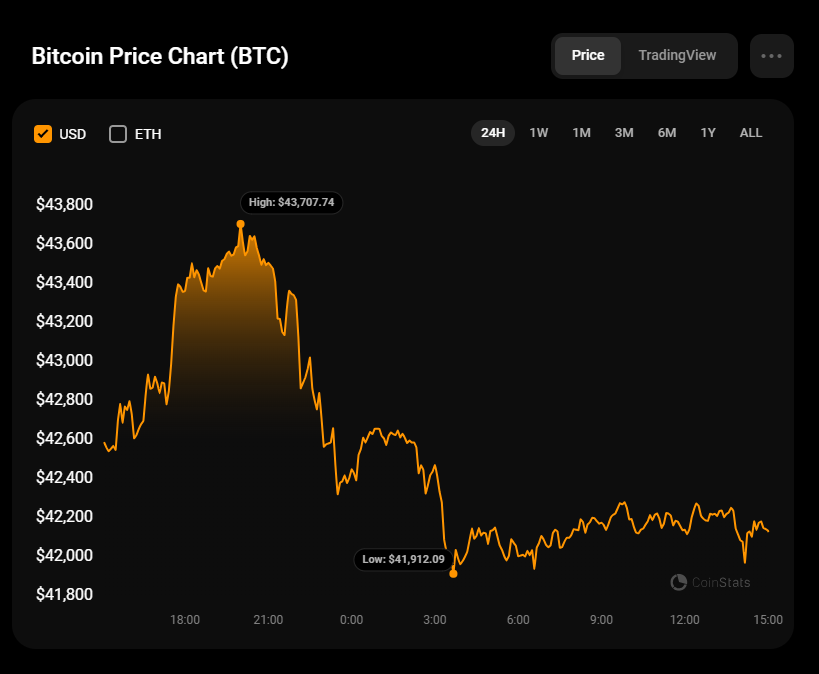
Buyers remain weaker than sellers, according to CoinStats.
BTC/USD
The price of Bitcoin (BTC) has dropped by 1.22% since yesterday.
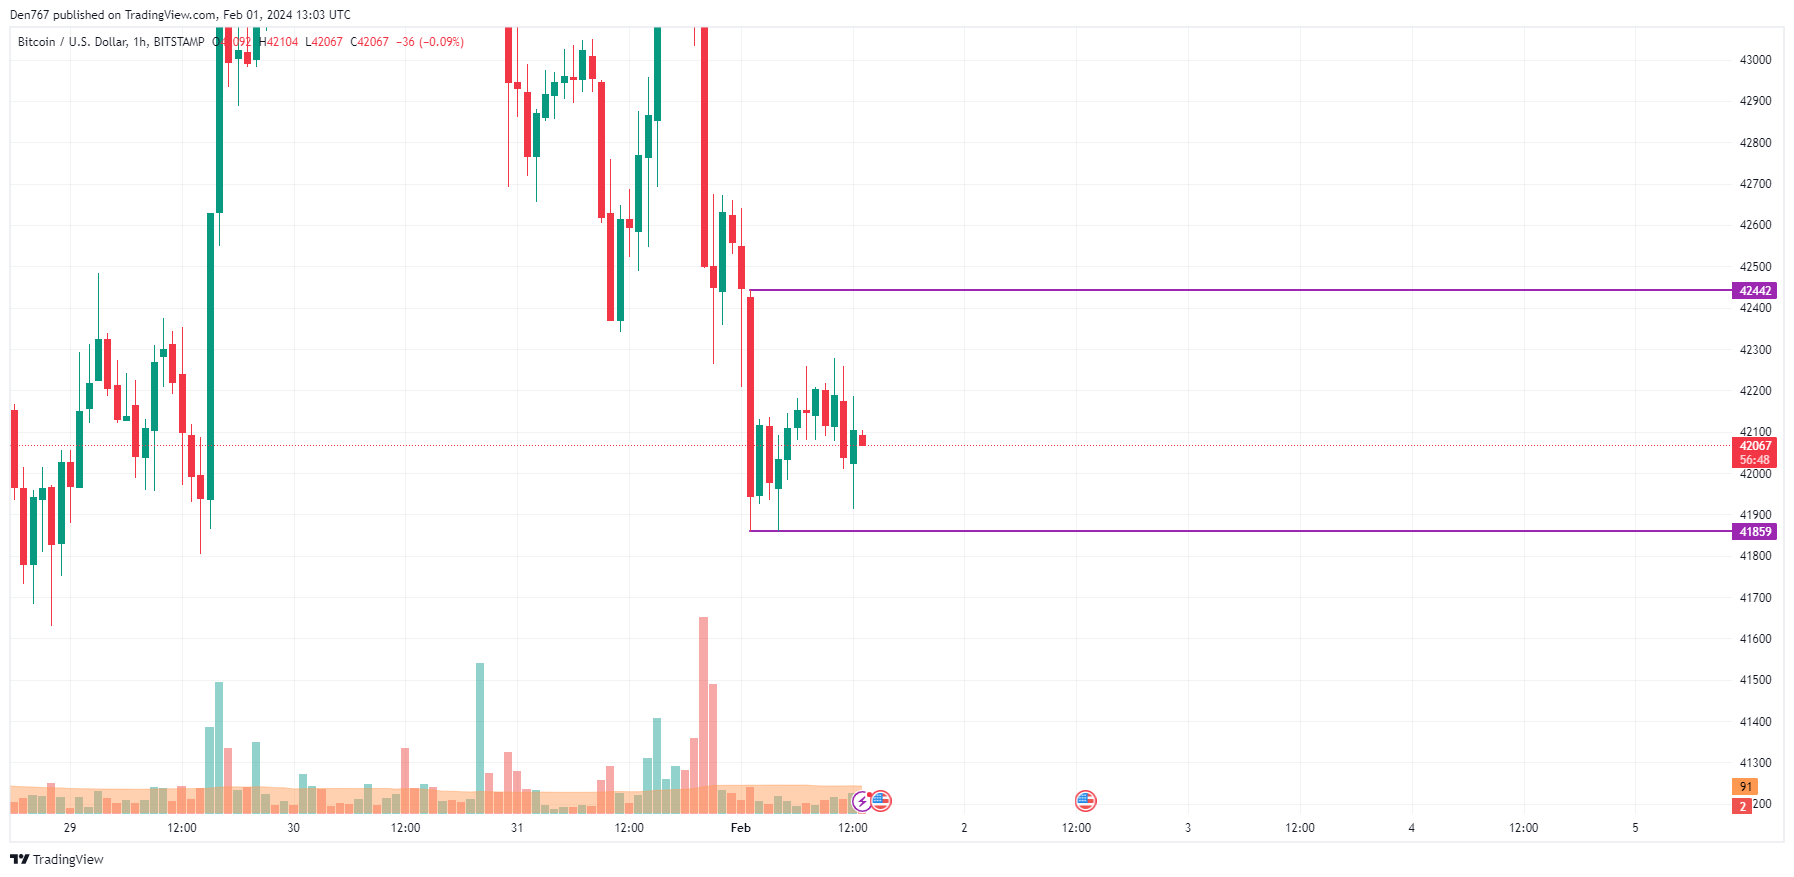
Despite today's decline, the rate of BTC remains bearish on the hourly chart. If the daily bar closes near the $41,900 zone, the accumulated energy might be enough for a further decrease to the $41,500 zone.
On the bigger time frame, one should pay attention to the $42,000 area. If bulls lose it, the correction is likely to continue to $41,000. Such a scenario is relevant until mid-February.
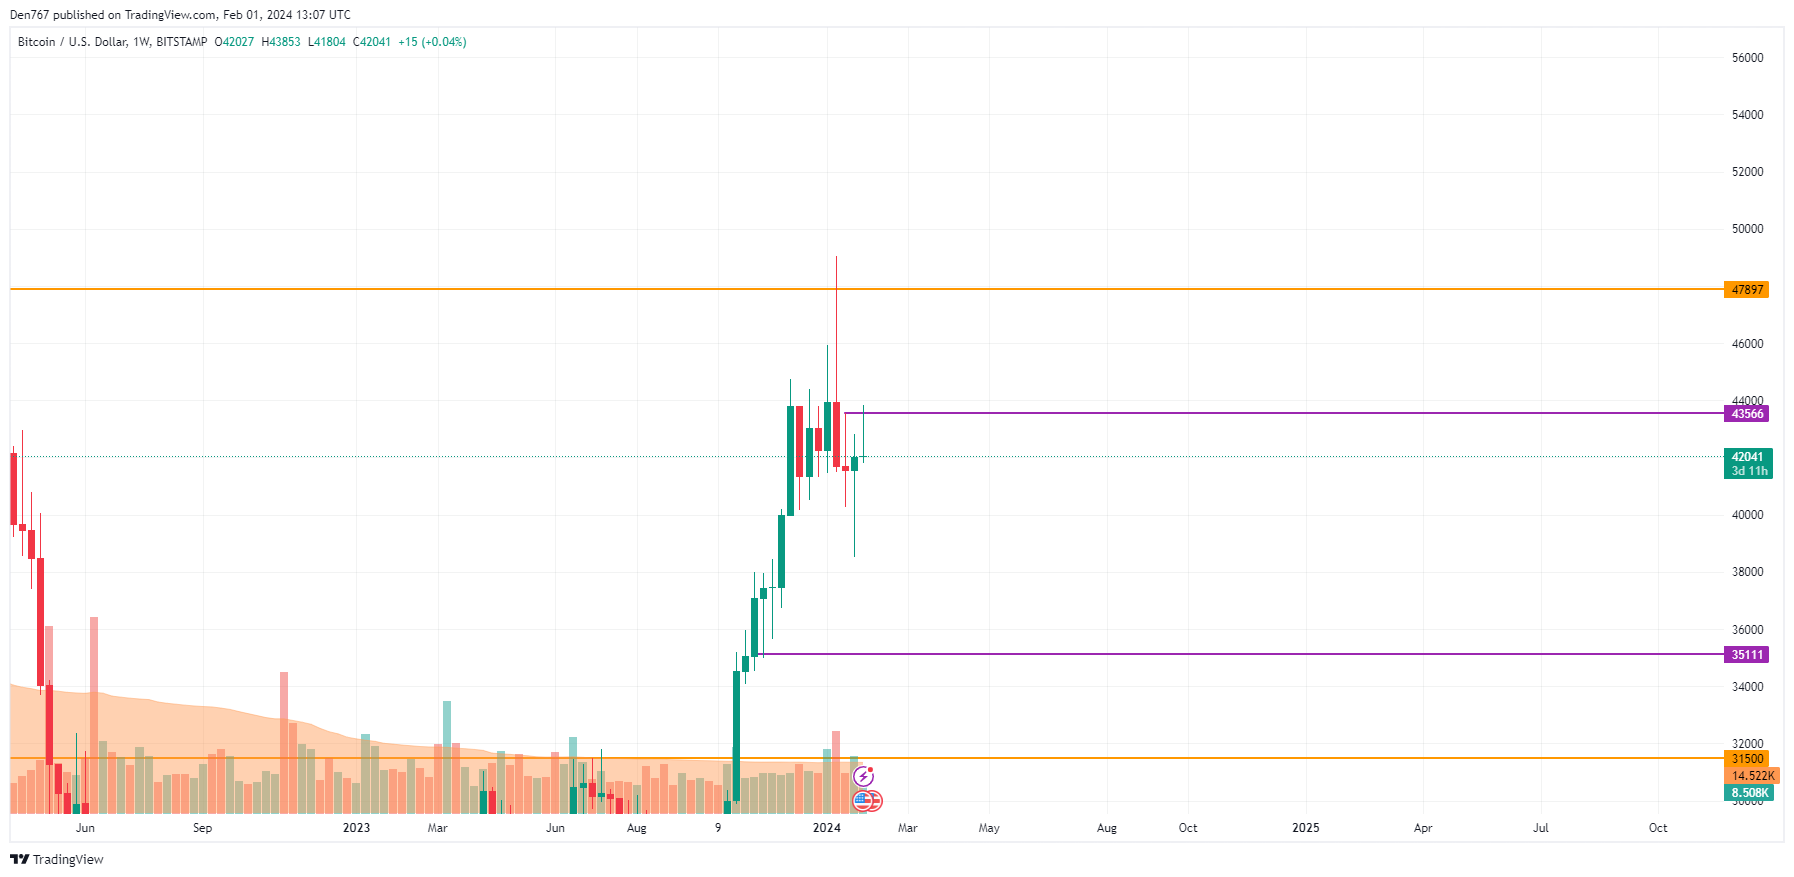
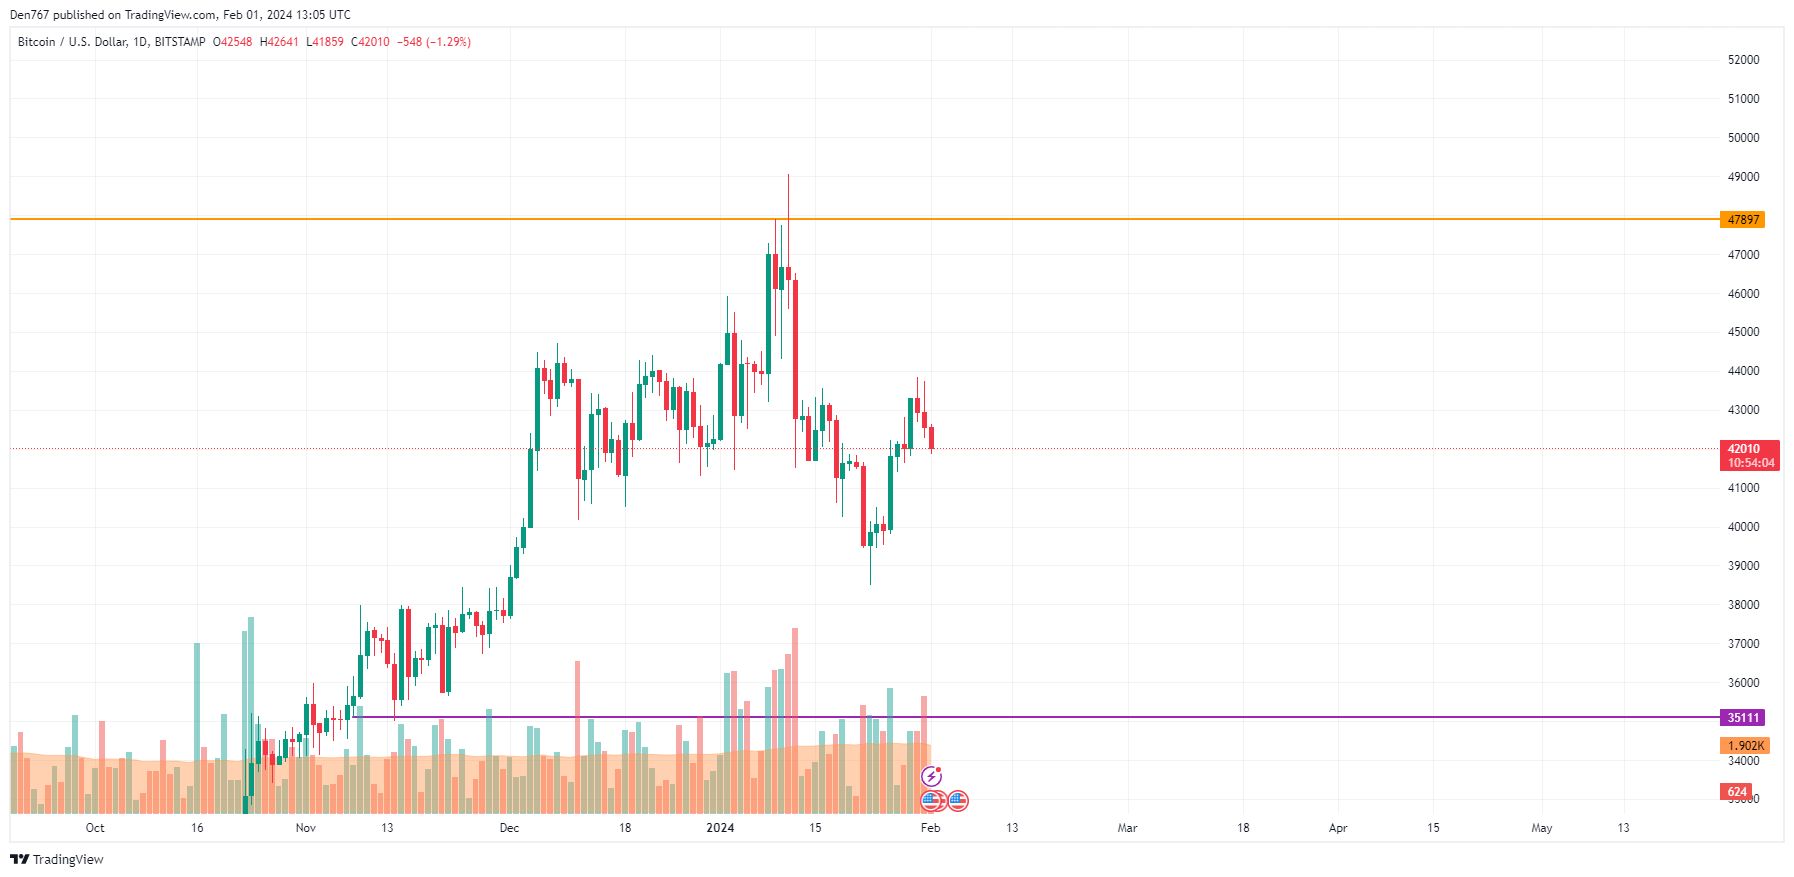
From the midterm point of view, the price of BTC keeps falling after a false breakout of the recently formed resistance level of $43,566.

If the bar closes far from that mark, one can expect a test of the vital zone of $40,000.
Bitcoin is trading at $42,038 at press time.
 Dan Burgin
 U.Today Editorial Team