Binance Coin (BNB) is the brainchild of one of the biggest crypto exchanges in the world; Binance. It runs natively on the Ethereum blockchain under the ERC20 protocol, has a total supply of 200 million and is the 10th cryptocurrency by Coinmarketcap. The token was initially launched in July 2017 and has a solid following.
Binance has a major long-term catalyst for its coin. The company plans to use 20% of their quarterly profits to buyback and then burn 50% of the entire supply of BNB. This means that eventually only 100 million BNB will exist which creates scarcity and possible price increase.
The latest coin burn occurred on January 16 when the Binance team destroyed $9.4 million worth of BNB tokens. Since then, Binance Coin enjoyed very bullish price action, which took it above $11.0
BNB/USD Technical Analysis – The Big Picture
In late 2018, Binance announced they are preparing to launch a Decentralized Exchange (DEX) and on January 20, 2019, said DEX entered public testnet phase. The DEX is powered by Binance Chain, which is a blockchain developed by - you guessed it – Binance. BNB, which is currently an ERC 20 token will eventually be migrated to the new blockchain and will become its native asset.
This could spell massive upswings for BNB in the long run, but could turn into adversity if the DEX fails to live up to expectations. One thing is certain: shortly after the announcement, Binance Coin started to enjoy positive sentiment and since then the token has risen from $6.20 to a high of $11.67, currently trading at $10.35.

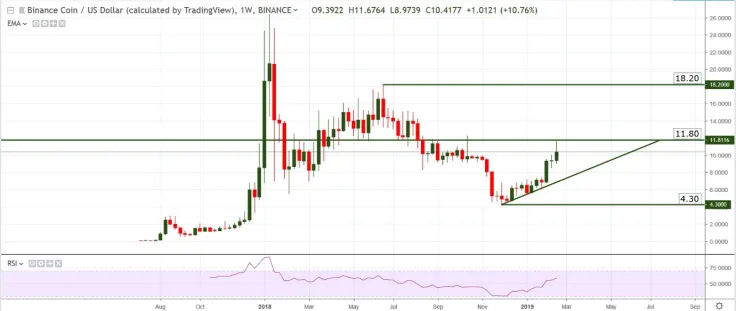
From a Weekly chart perspective, the token is not in a clear trend but it has been tracing lower highs and lower lows since it hit a recent high. The climb that started at $4.30 shows strong bullish pressure and could develop into long term bullish price action once the coin retraces to support. The Relative Strength is moving north, without being overbought, which supports a bullish scenario for the next months. For long-term bullish activity to happen resistance at $11.80 - $12.00 must be broken decisively.
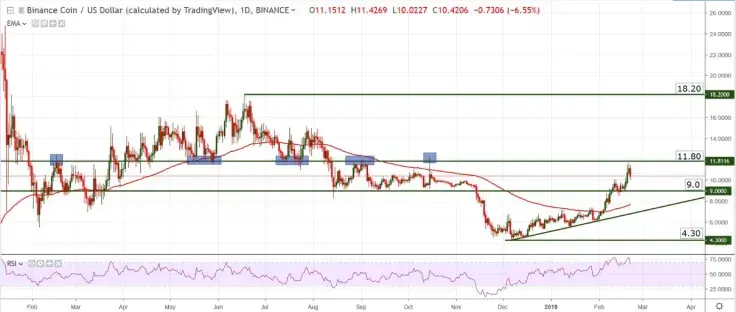
On a Daily chart we can better see the importance of the resistance level at $11.80. It has been touched multiple times from above and below and more often than not, price was rejected. Most recently, we can see that rising price hit resistance at this level again and is now retracing lower.

Considering all the factors involved, Binance Coin could climb into $18 area over the next six months but for this to happen Binance’s DEX must perform well. Immediate retracements should find support at $9.0, but a break below would not invalidate the long term bullish scenario as long as the trend line is intact and the DEX project is still viable.
Daily Chart Support: $9.0 and 100 days EMA (red line)
Weekly Chart Support: bullish trend line and $4.30
Daily Chart Resistance: $11.80 and $15.0
Weekly Chart Resistance: $11.80, $15.0 and $18.20
Most likely scenario: continuation of bullish movement, break of $11.80 and move into $15.0 where a deep retracement may occur; Longer-term a touch of $18 over a few months
Alternate scenario: breakdown below the bullish trend line
 Tomiwabold Olajide
 Caroline Amosun
 Dan Burgin
 Godfrey Benjamin