Disclaimer: The opinions expressed by our writers are their own and do not represent the views of U.Today. The financial and market information provided on U.Today is intended for informational purposes only. U.Today is not liable for any financial losses incurred while trading cryptocurrencies. Conduct your own research by contacting financial experts before making any investment decisions. We believe that all content is accurate as of the date of publication, but certain offers mentioned may no longer be available.
Popular meme coin Shiba Inu (SHIB) is showing the first signs of recovery after a prolonged nosedive. After losing 24% of its value in June, the token formed a bullish technical pattern on the short-term TradingView chart in early July, signaling potential upside.
On the 4-hour chart, SHIB recorded a crossover of the fast 23-period moving average above the slower 50-period one. This pattern, known as a "Mini Golden Cross," formed near the $0.000004346 mark.
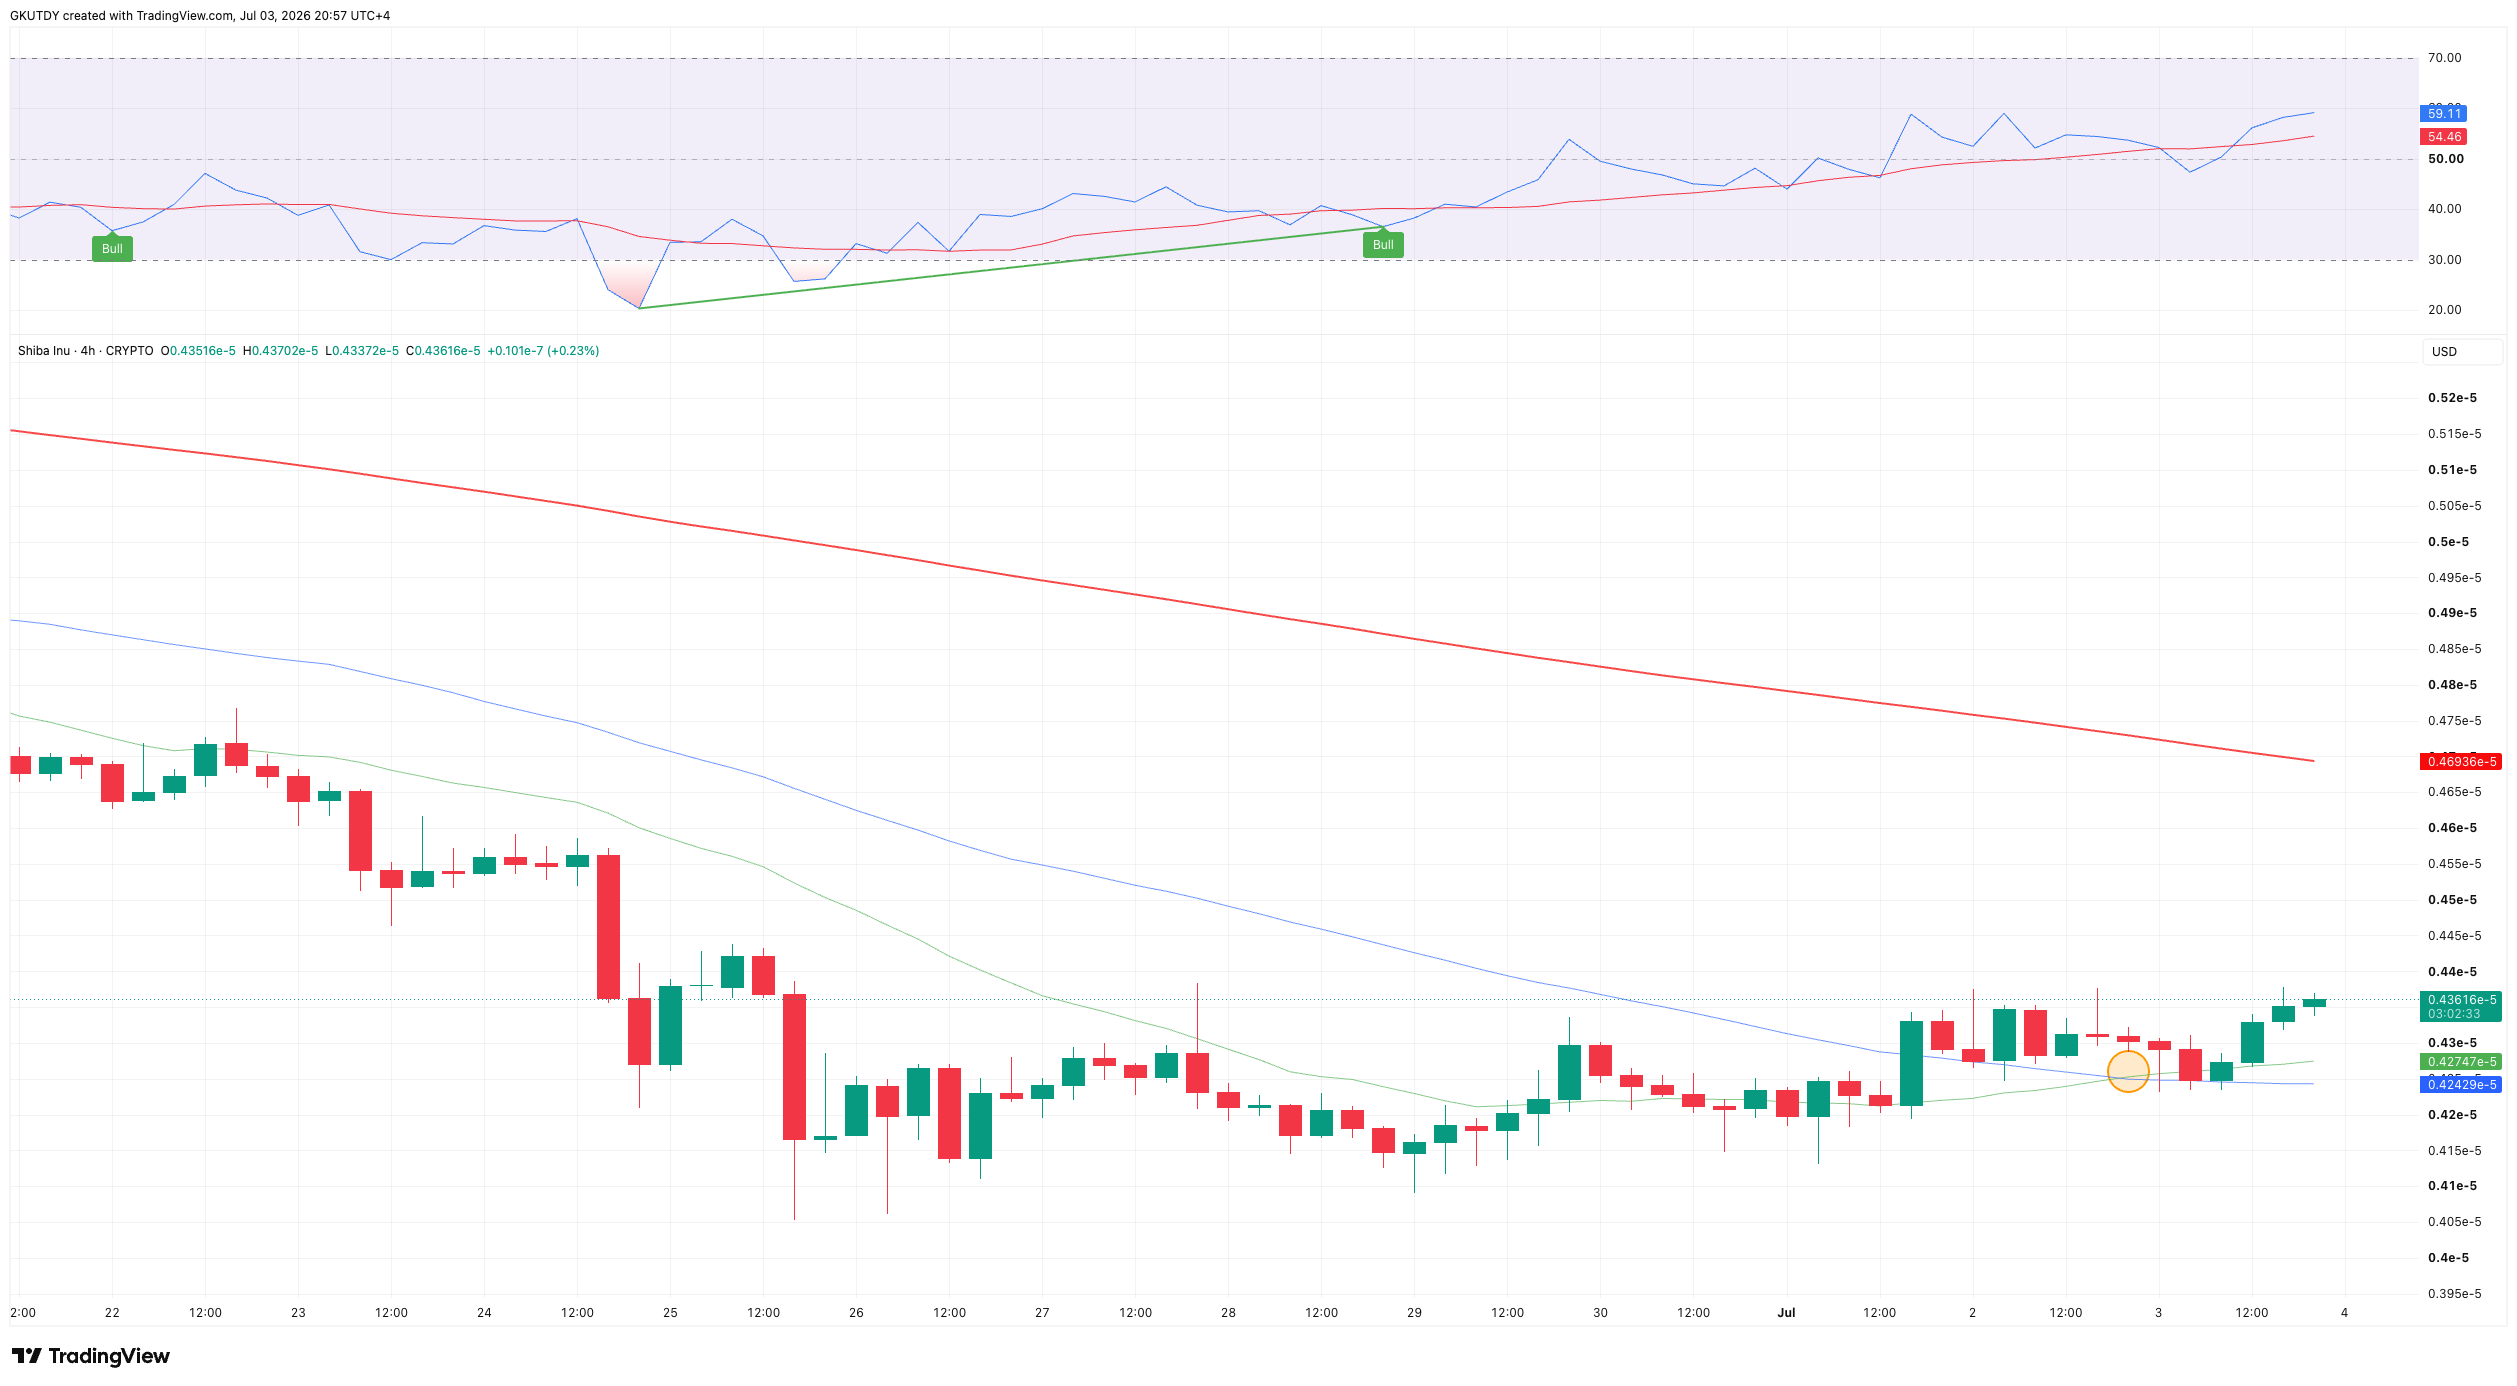
This impulse opens the way for the asset toward local resistance with 9% upside potential. The nearest target is the $0.00000470–$0.00000480 price range, where the long-term 200-period moving average, MA 200, is putting pressure on the price.
July seasonality vs. 200 MA resistance
The current rebound is confirmed by historical cycles from CryptoRank, according to which July has traditionally been a comeback month for the Shiba Inu coin after spring-summer sell-offs. As of July 3, the asset has already gained 3.56%, confidently moving toward the month's historical median return of 6.24%.
Past-year statistics show that July has almost always closed in the green: in 2022, the token rose by 13.4%; in 2023, by 11.8%; and in 2025, by 8.92%. Current market cycles show that the 9% upside built into the chart is not random and fully fits within the standard July recovery pattern.

Further price movement depends on how the asset reacts to key levels in the coming trading sessions:
- Bullish case: SHIB holds above $0.000004346, plays out the Mini Golden Cross and breaks through the MA 200, heading toward the historical target of +9%, near $0.00000475.
- Bearish case: The price runs into resistance from the heavy moving average, the pattern breaks down, and the asset returns to its June lows, testing psychological support at $0.00000400.
Right now, the token is trying to lock in its local success and reverse the prolonged bearish trend. However, the situation on the chart is heating up, as the price has moved very close to the heavy MA 200.
The coming trading sessions will show whether Shiba Inu can maintain its current momentum and complete the historical scenario, or whether the meme token will face strong resistance near the upper boundary of the price corridor.
 Dan Burgin
 U.Today Editorial Team