

Disclaimer: The opinions expressed by our writers are their own and do not represent the views of U.Today. The financial and market information provided on U.Today is intended for informational purposes only. U.Today is not liable for any financial losses incurred while trading cryptocurrencies. Conduct your own research by contacting financial experts before making any investment decisions. We believe that all content is accurate as of the date of publication, but certain offers mentioned may no longer be available.

Spot-market demand for Shiba Inu is once again declining; all seven significant spot-flow timeframes now display negative net flows. The imbalance occurs as SHIB finds it difficult to break above the $0.00000500 mark, placing the token in a precarious technical position.
Netflows flip to negativity
Over longer time periods, the spot-flow data reveals increasingly significant outflows. Over 15 minutes, net flow is roughly -$14,540, over 30 minutes, it is -$26,680, and over an hour, it is -$63,710. Over four hours, the imbalance increases to -$134,800, over eight hours, to -$168,720, and over twelve hours, to roughly -$250,040.
Sellers are continuously transferring more value out than buyers are bringing in over the specified time periods. Crucially, negative spot net flow does not always indicate that SHIB is going to fail. Rather than being a precise prediction of future prices, these numbers reflect the equilibrium between buying and selling activity on tracked spot markets, depending on the methodology.
Price takes a plunge
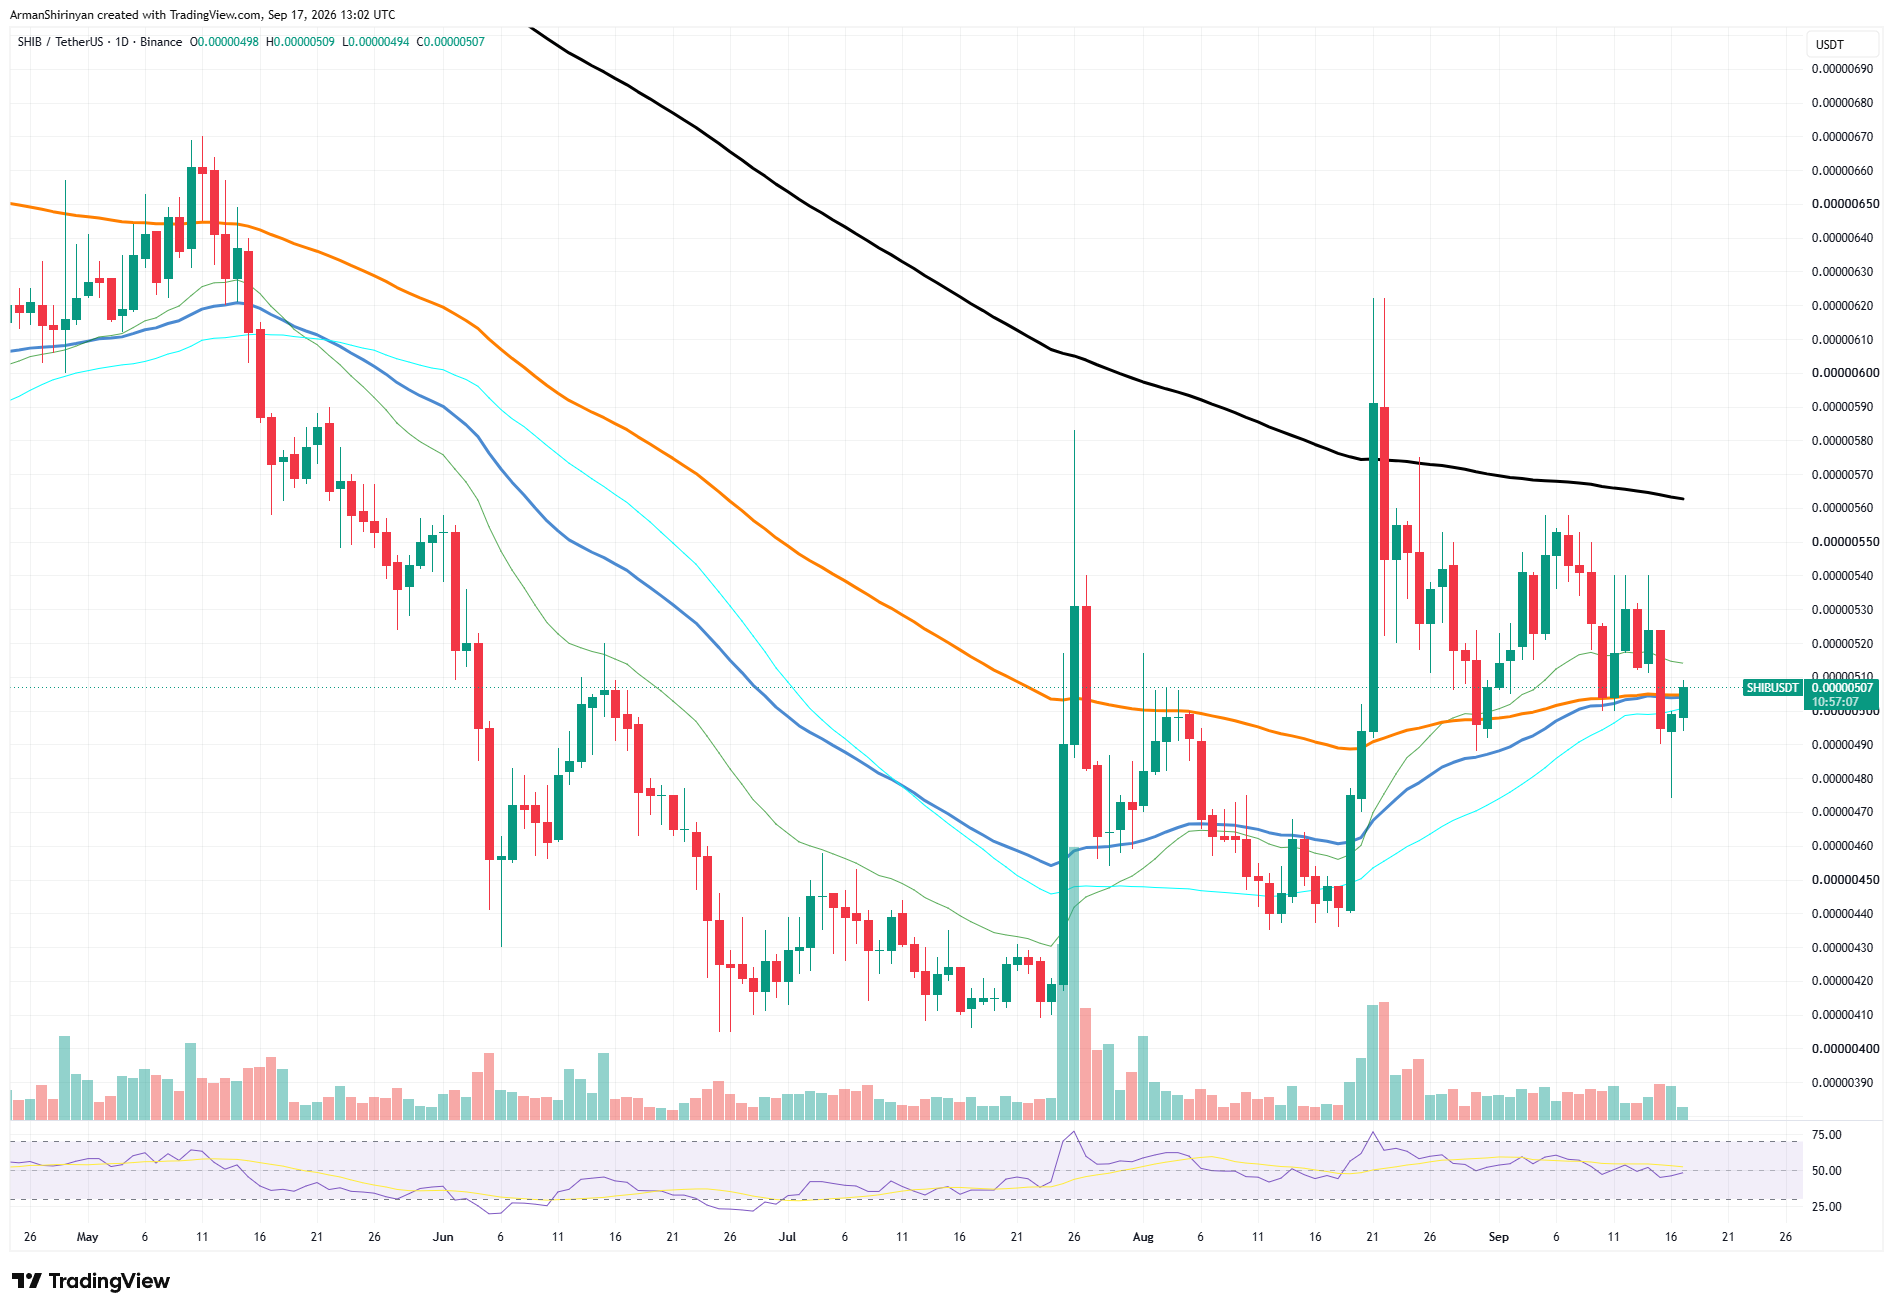
That issue is reflected in the chart. At the moment, SHIB is trading at about $0.00000507, directly between a number of short- and medium-term moving averages that are grouped around $0.00000495–$0.00000515. This results in a technical setup that is unusually compressed, where the next direction may be determined by relatively small price movements.

The first significant challenge is located between $0.00000515 and $0.00000520. SHIB has frequently had trouble sustaining its momentum above this region. Stronger resistance is found between $0.00000540 and $0.00000550, which is followed by the declining long-term moving average close to $0.00000565.
On the downside, losing $0.00000490 would expose $0.00000460–$0.00000470 and significantly weaken the structure. The RSI is still close to the neutral 50 range, providing neither side with much momentum support.
As a result, SHIB is experiencing a demand issue at the exact moment when its technical structure requires increased buying pressure. Another attempt to break above the moving-average cluster may find it difficult to develop into a sustained recovery unless spot flows improve.
 Dan Burgin
 U.Today Editorial Team
