Disclaimer: The opinions expressed by our writers are their own and do not represent the views of U.Today. The financial and market information provided on U.Today is intended for informational purposes only. U.Today is not liable for any financial losses incurred while trading cryptocurrencies. Conduct your own research by contacting financial experts before making any investment decisions. We believe that all content is accurate as of the date of publication, but certain offers mentioned may no longer be available.
While part of the crypto community is becoming increasingly convinced this weekend that a deep correction is coming for XRP, relying in part on technical patterns across crypto charts, other indicators — particularly on the daily XRP/USD chart on TradingView — are beginning to suggest the exact opposite. The bearish scenario of a 30% drop below the $1 level for XRP may turn out to be more of a bear trap than an inevitability.
Popular analysts, including Ali Martinez, have recently emphasized XRP’s weakness, pointing to a potential decline toward $0.95. However, these conclusions are largely based on the four-hour time frame and a triangle pattern, which XRP has broken below.
Why analysts predicting 30% XRP price drop could be wrong
A closer look at the daily time frame reveals that buyer strength is still present, though hidden within the current consolidation phase. According to the volume profile, the main trading activity — the point of control — sits within the $1.37-$1.45 range. The current price of $1.33 is slightly below this major volume block, which in classical technical analysis is often interpreted as a false breakdown designed to collect liquidity before a reversal.
If XRP were truly preparing for a 30% drop, it would have already moved quickly through this zone without resistance. Instead, the ongoing accumulation suggests that large players are holding prices while absorbing sell pressure.
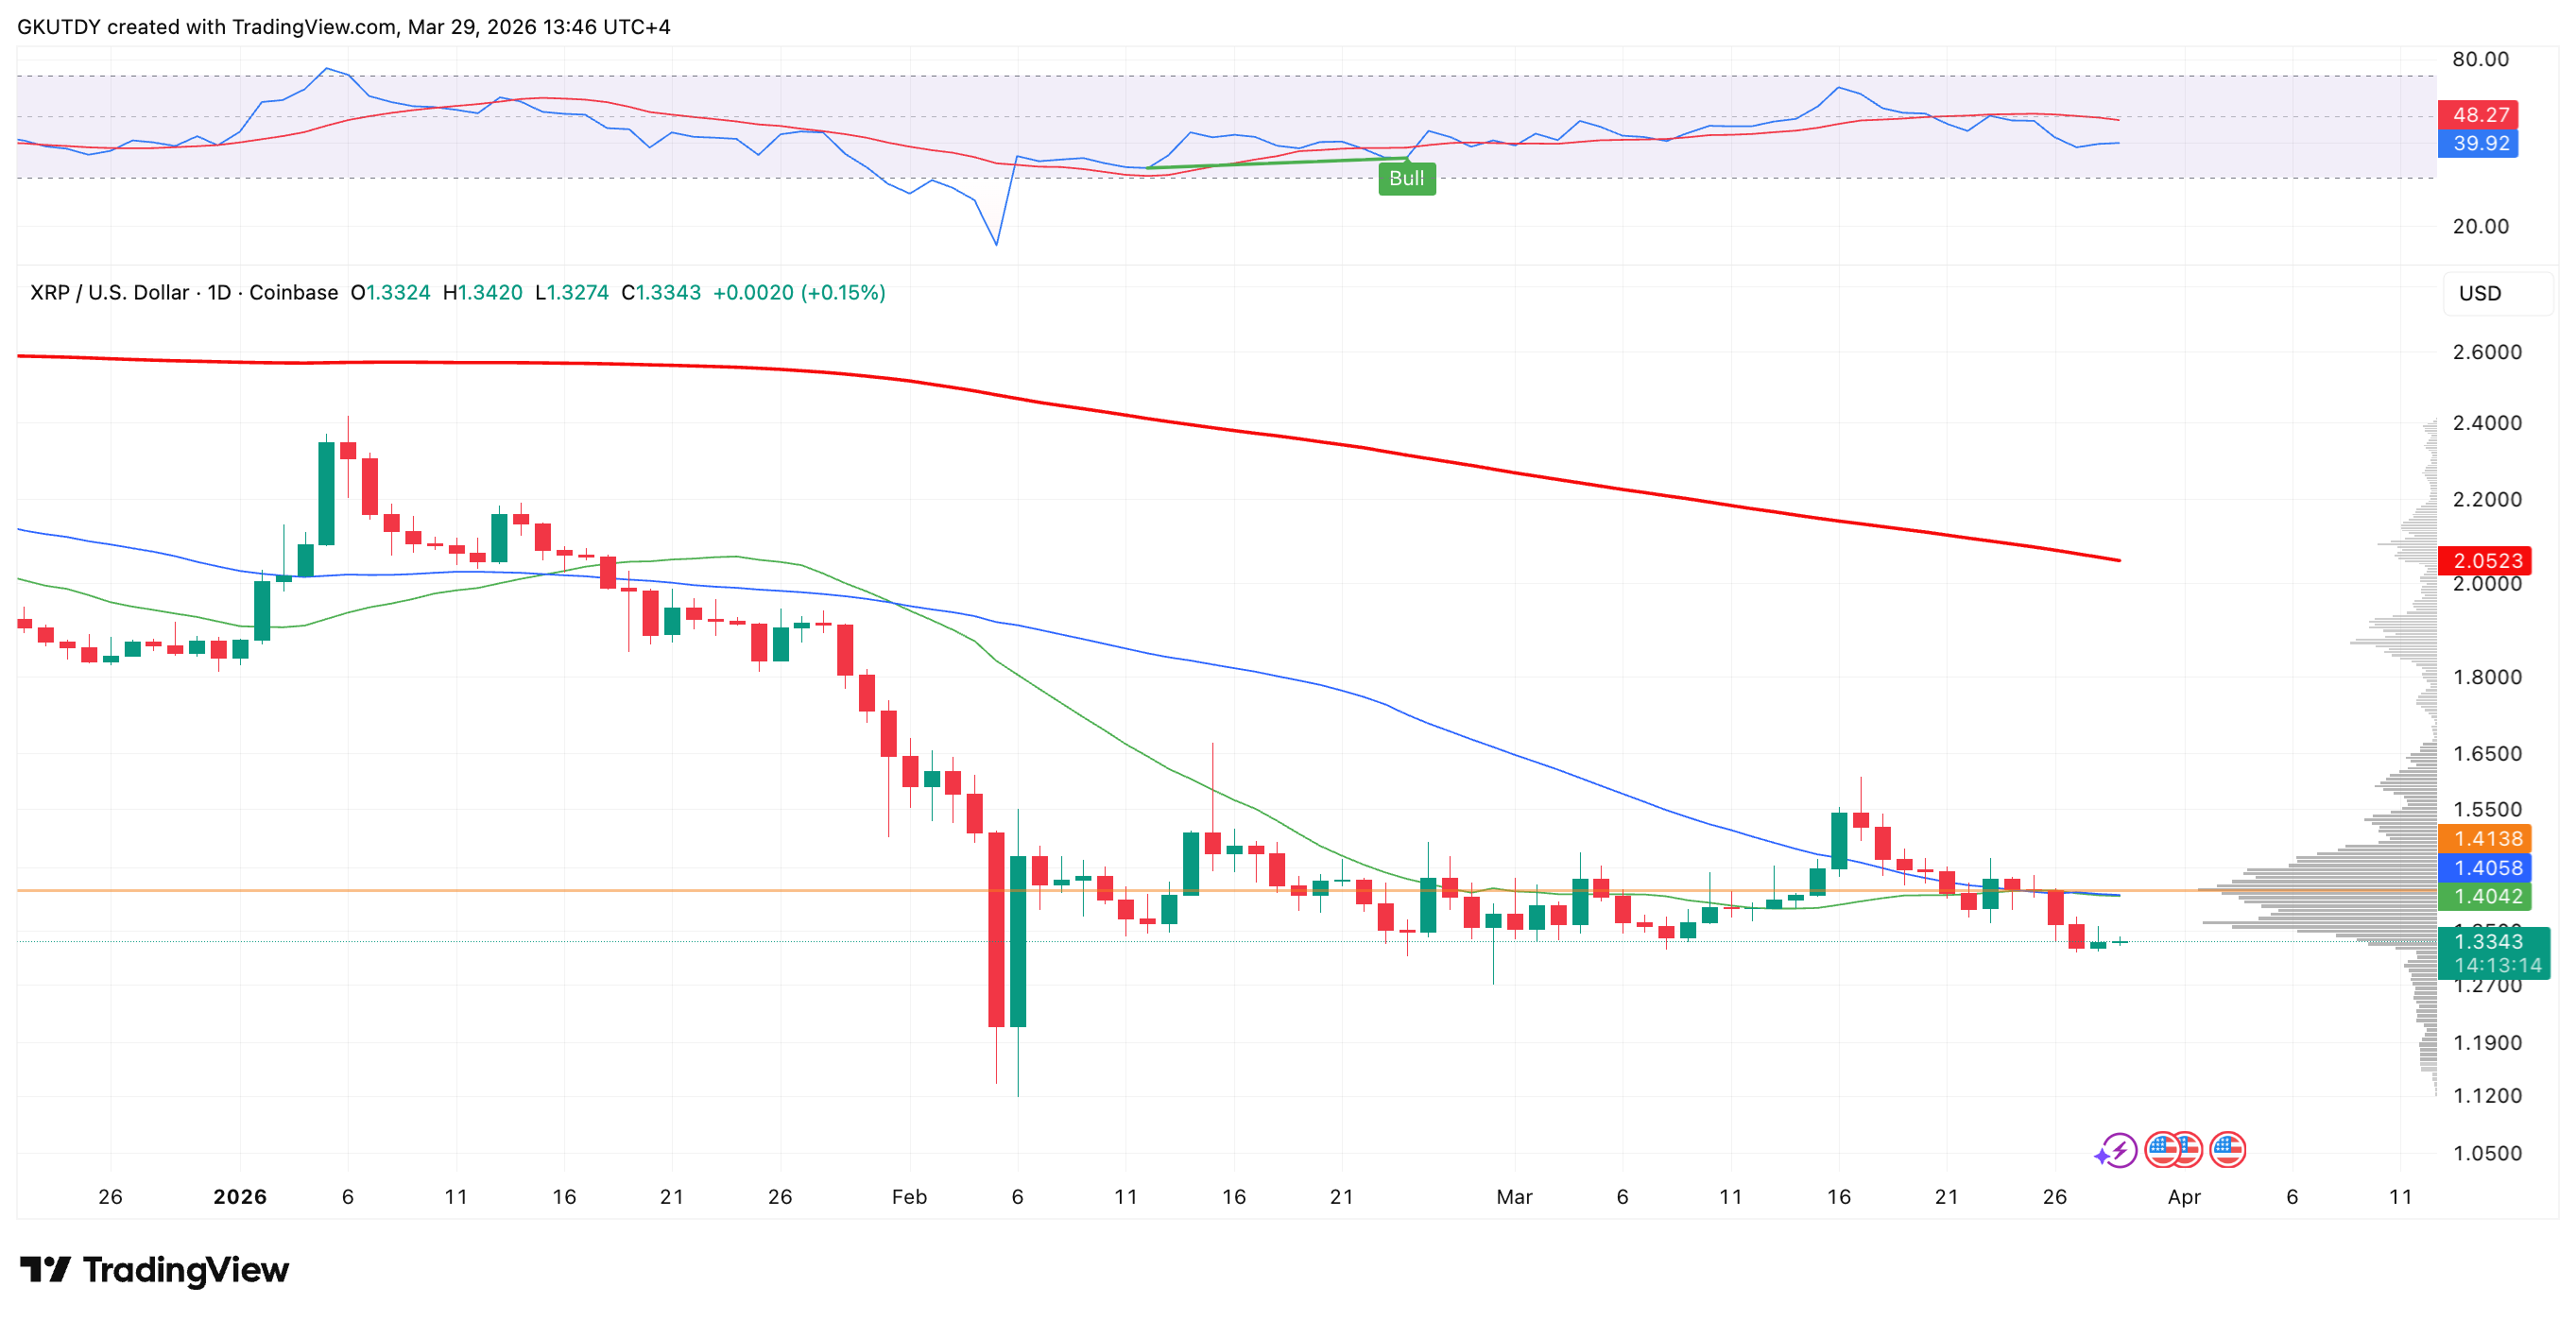
At the same time, the Relative Strength Index on the daily chart is sending a bullish signal too. While XRP price printed lower lows in February and March, RSI formed higher lows. This bullish divergence is one of the most important leading indicators, signaling that bearish pressure is fading and the market may be preparing for an upward move.

The accumulation of volume combined with the RSI signal suggests that XRP is in the final stage of a shakeout before the start of a new bullish cycle. The key moment will be the close of the March candle. If XRP holds above $1.37, the bearish scenario outlined by Martinez and other skeptics may be invalidated.
 U.Today Editorial Team
 Dan Burgin