Disclaimer: The opinions expressed by our writers are their own and do not represent the views of U.Today. The financial and market information provided on U.Today is intended for informational purposes only. U.Today is not liable for any financial losses incurred while trading cryptocurrencies. Conduct your own research by contacting financial experts before making any investment decisions. We believe that all content is accurate as of the date of publication, but certain offers mentioned may no longer be available.
TL;DR
- XRP targets $2: Bollinger Bands are tightening, signaling a massive price "squeeze." Analysts eye the $2 level (aligned with the 200-day moving average) as the next breakout target if resistance clears.
- Bitcoin’s $71,000 short squeeze: BTC saw a 500% liquidation imbalance, wiping out over $100 million in bear positions.
- Whale activity on Shiba Inu: A massive 494 billion SHIB ($2.7 million) transfer from Coinhako to Cumberland DRW suggests major OTC accumulation by "smart money."
XRP sets $2 price target via Bollinger Bands
After rising by almost 4% since the opening of trading on Tuesday, the XRP/USD chart on TradingView is showing an interesting technical picture. Simply put, the cryptocurrency is now compressing like a spring, and many expect that it may soon shoot toward the $2 level.
Looking at the details, most of the analysis is based on the Bollinger Bands. As can be seen on the chart, this is the blue line represented by the 20-day moving average with two deviations around it, forming a corridor around the price. The idea is that when these lines come closer together, as they are doing now, a squeeze forms that usually precedes strong price movement.
At the same time, the 200-day moving average, which is an important medium-term level, is currently located right around the $2 area. If XRP breaks the current narrow resistance to the upside, the potential momentum could push it precisely toward these levels.
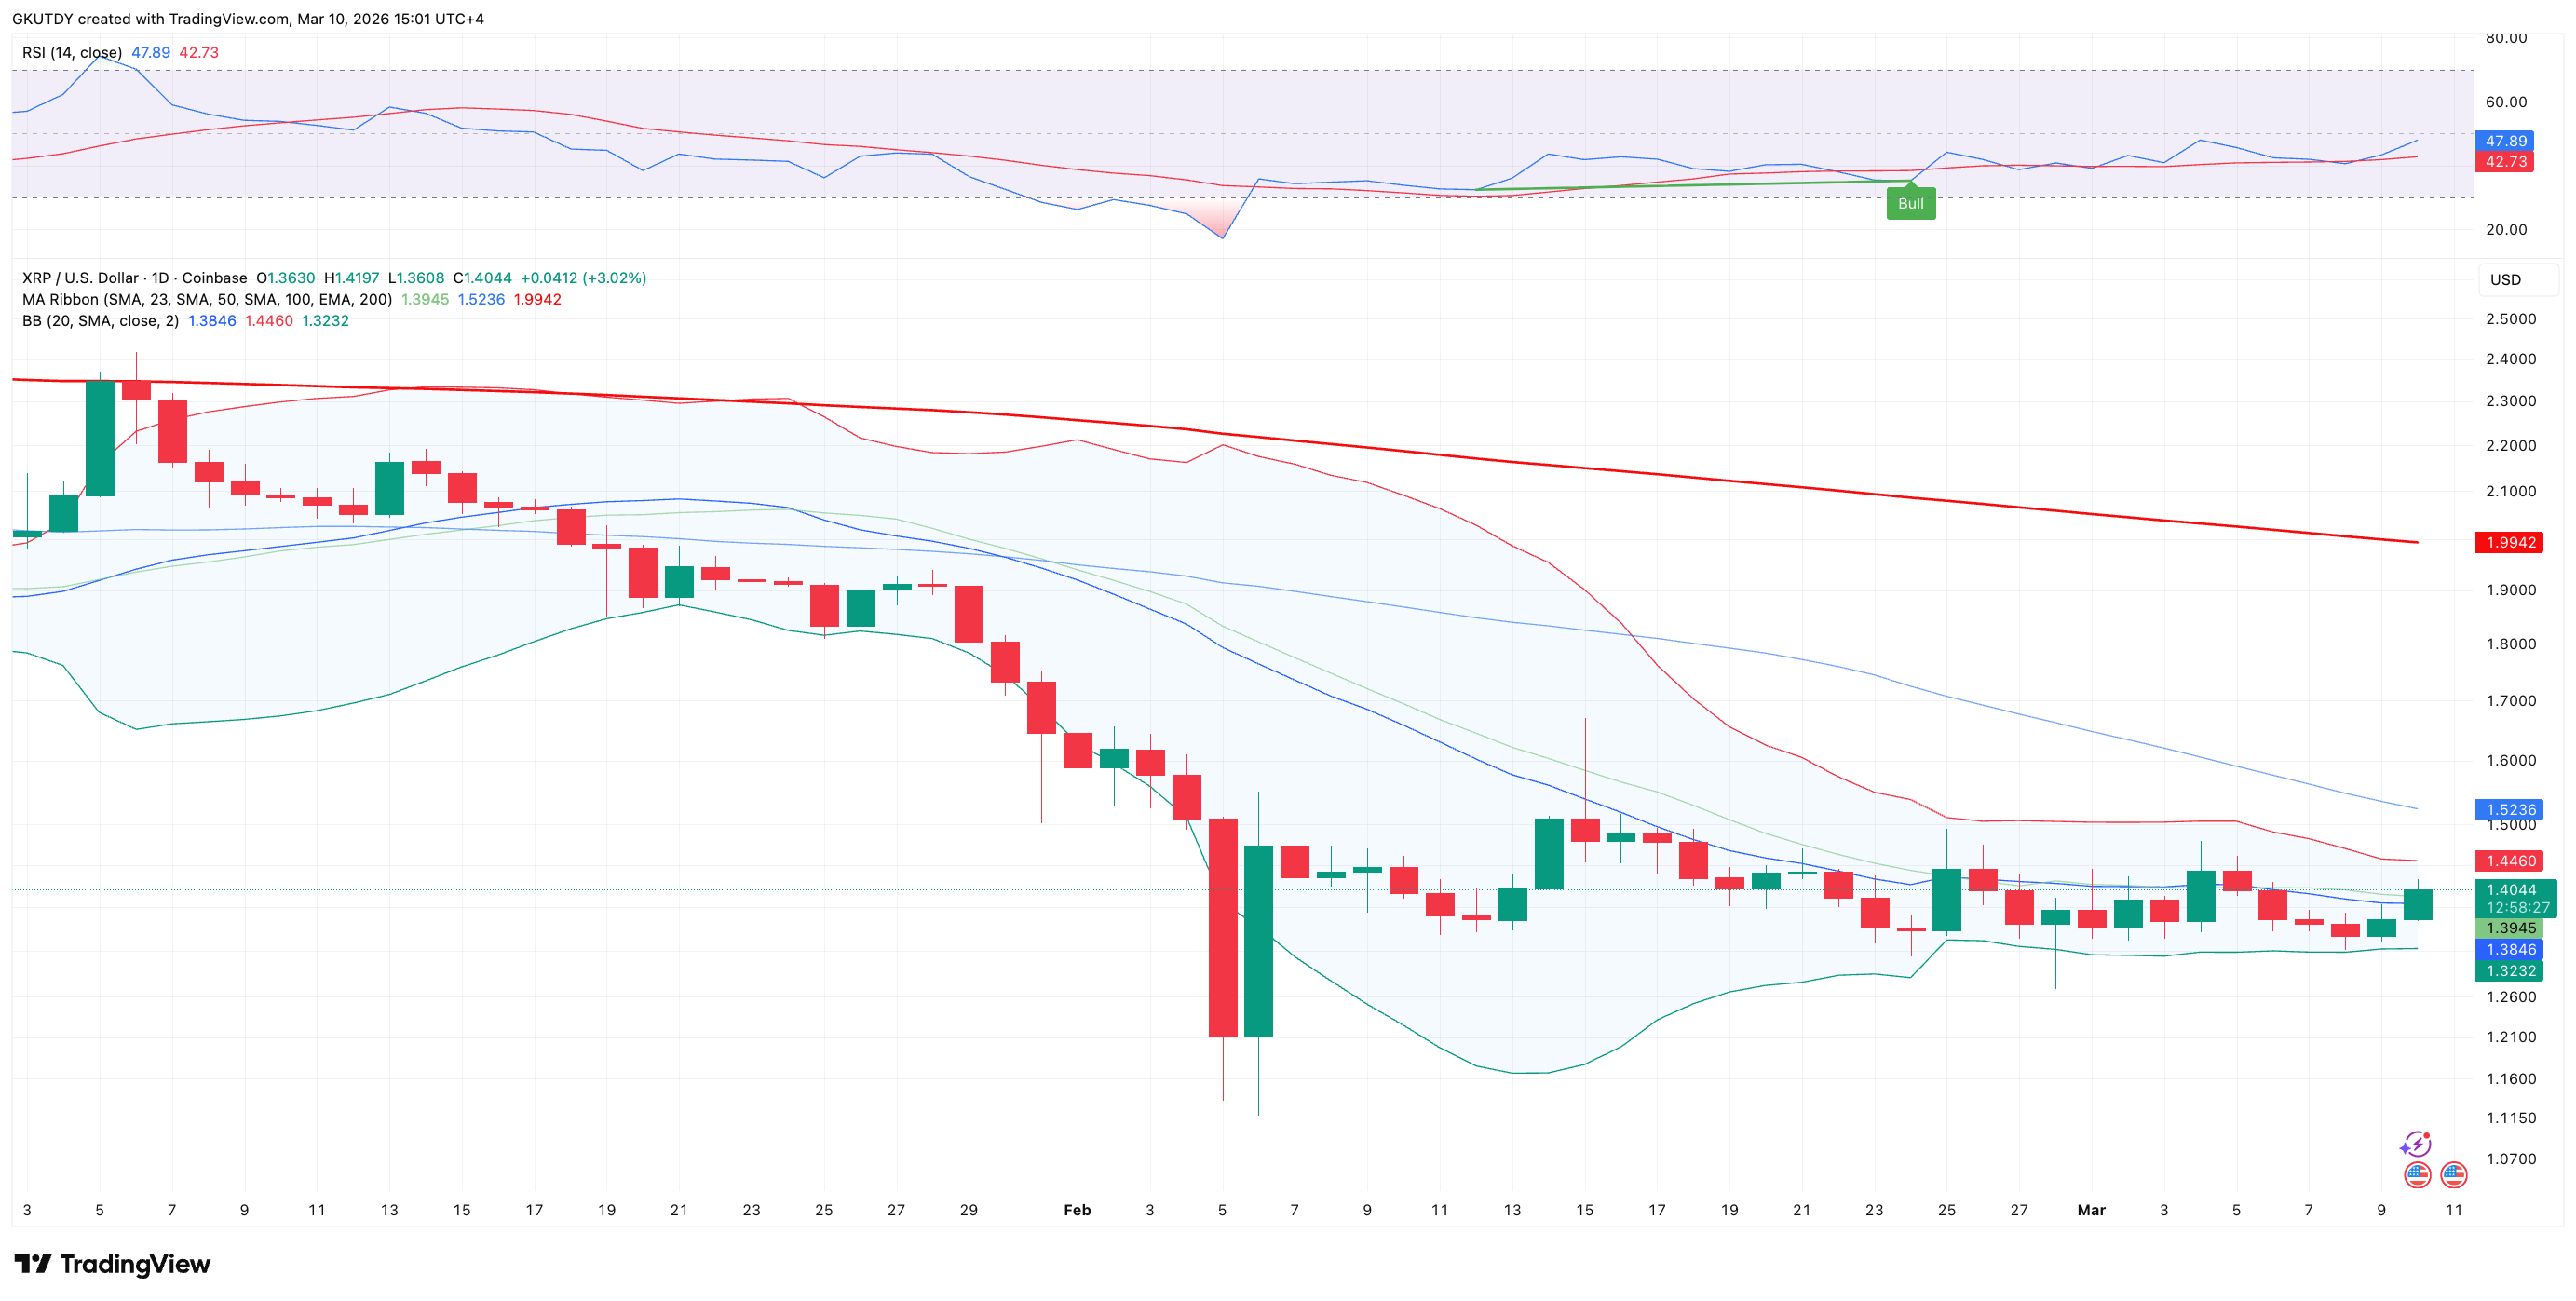
The Relative Strength Index also deserves special attention. It is currently located around 49, which places it in the neutral zone. This is considered positive because the asset is not overbought, meaning there is no overheating. It is stabilizing after the oversold conditions seen in February, which provides a fairly large amount of room for further upside before the market begins to consider the price too high.
Considering that after the sharp drop at the beginning of February the XRP price moved into a sideways range, what is happening now could be described as accumulation. Most likely, larger players are buying coins from those who panic-sell, preparing for a later price expansion.
Bitcoin (BTC) hits 500% liquidation imbalance in $71,000 push
At the same time, Bitcoin is experiencing a classic example of a short squeeze that occurred during the attempt to break above the $71,000 level. If in the case of XRP we were discussing potential growth, here we are observing a fire that has already taken place on the derivatives market.
On the heatmap from CoinGlass, a large red block for BTC shows that over the last 24 hours, positions worth more than $122 million were liquidated. Out of this amount, $101.6 million were losses from bears who were betting on a price decline.
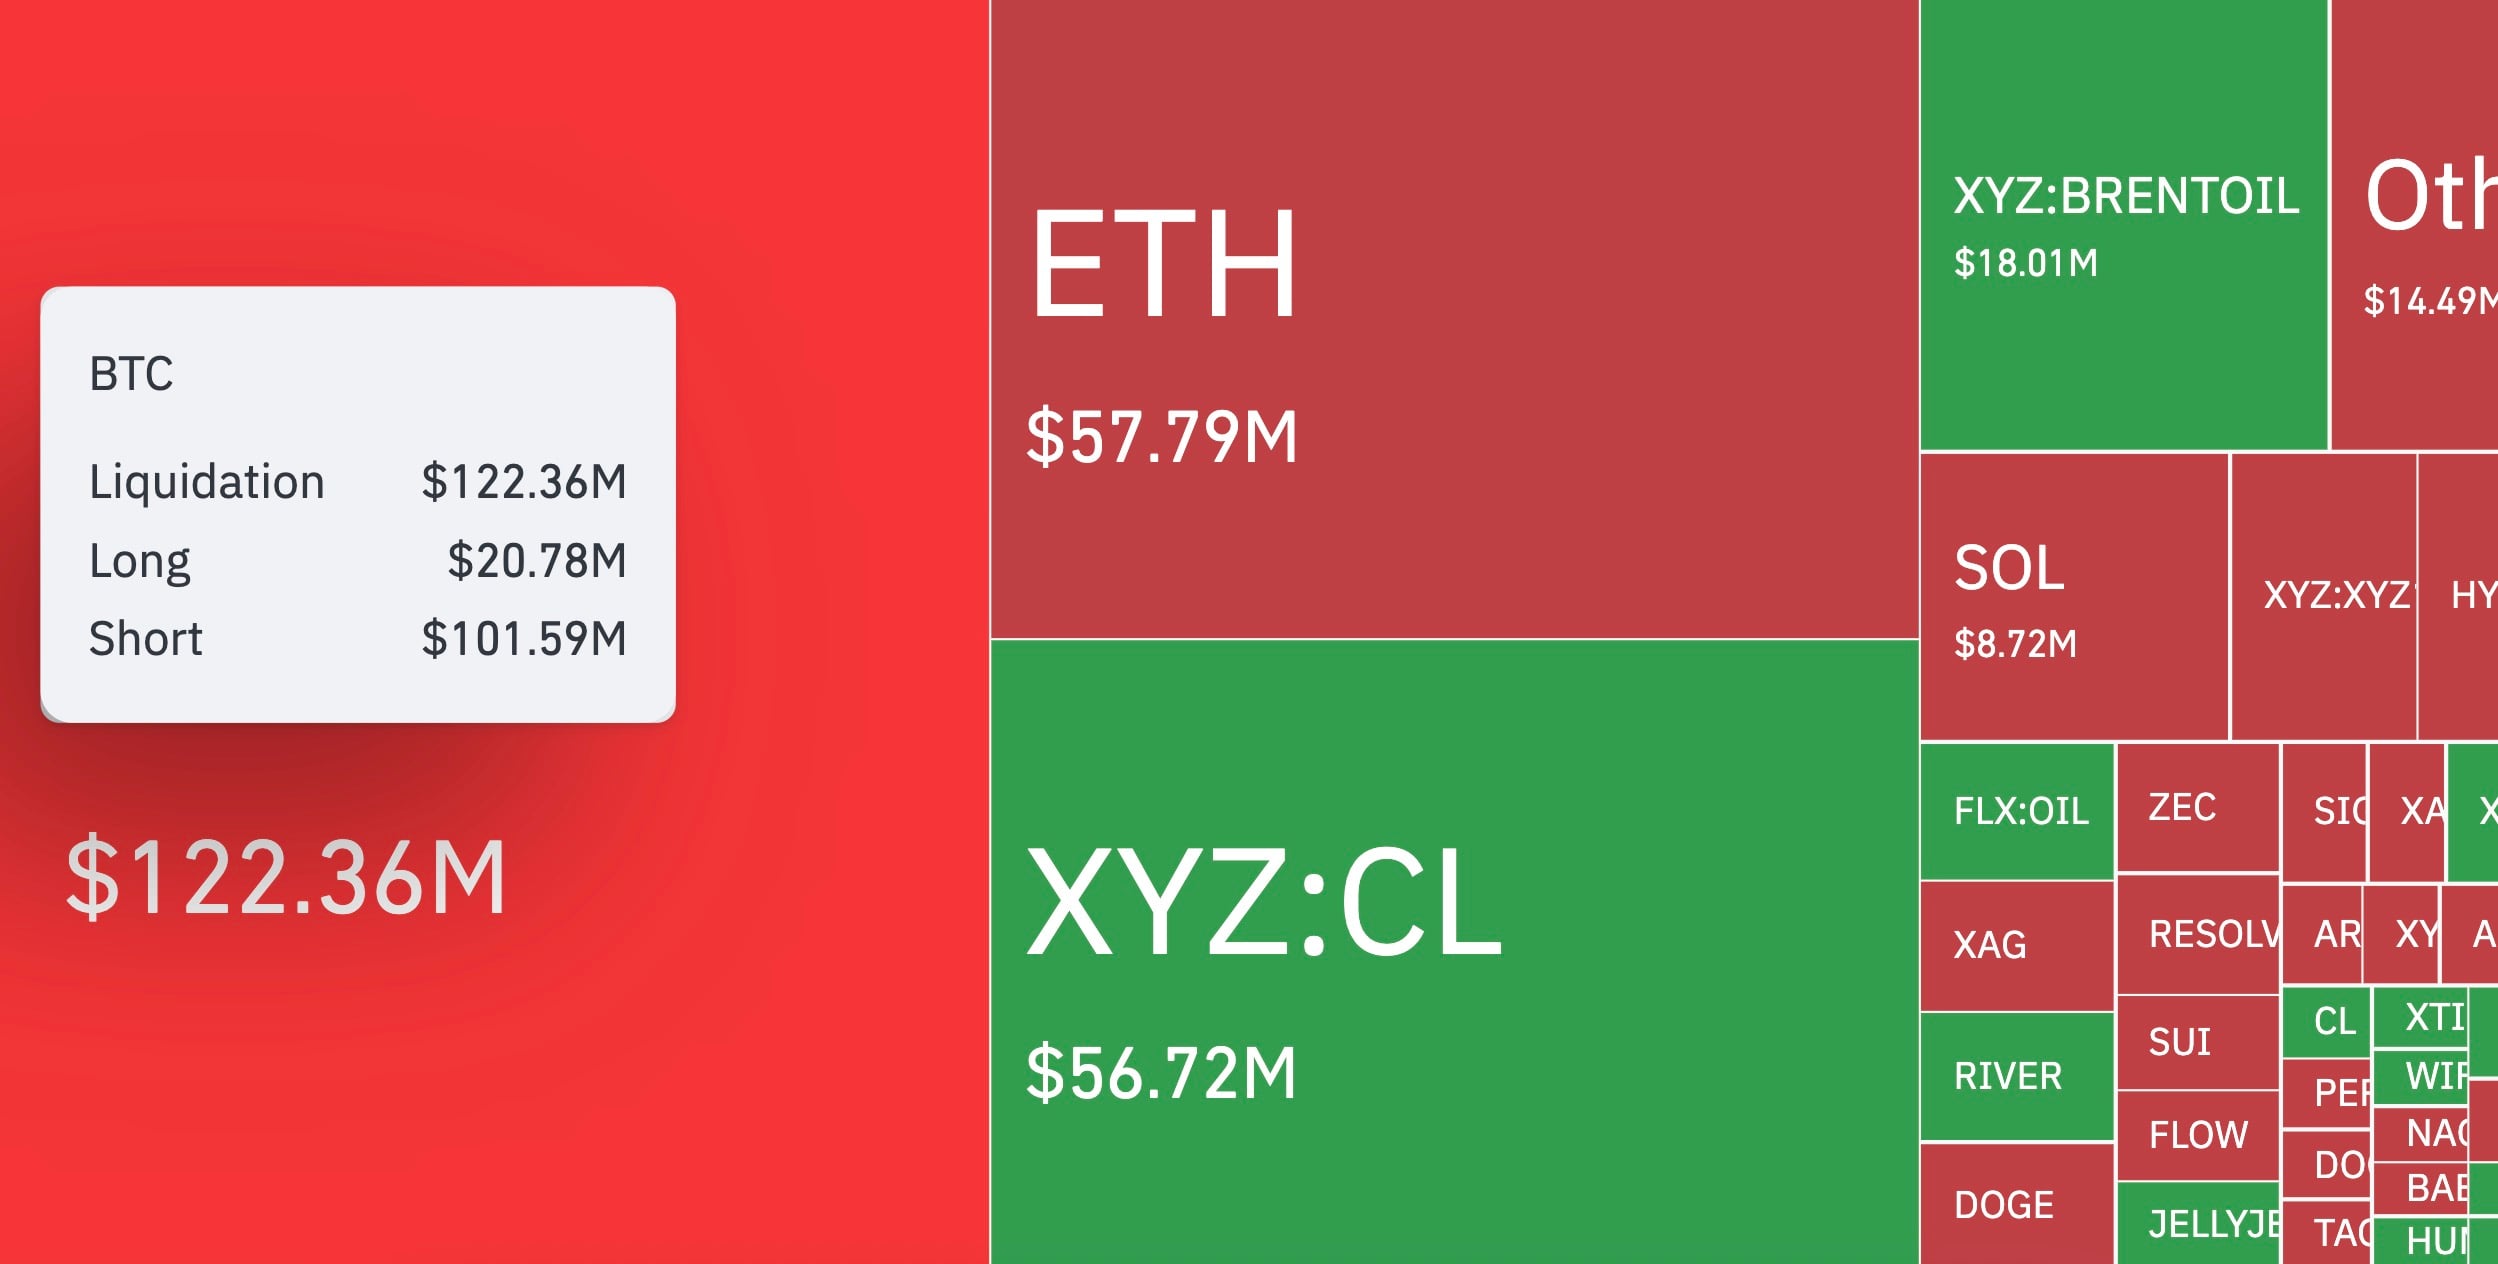
Short positions were liquidated almost five times more than long positions, creating a 500% imbalance. This means the market moved upward so quickly that sellers simply did not have time to close their trades manually.
While the Bitcoin price started moving toward $71,000, it is important to recall that the day before it had closed at around $68,400. A domino effect began. Traders who had opened short positions around the $70,000-$71,000 range started facing forced closures.
The Bitcoin chart has been extremely sensitive to global developments, particularly those related to oil prices. Perhaps the most vivid illustration of how high the stakes were came from the liquidation of a single trader on Hyperliquid, who lost more than $8 million in just one trade.
Two scenarios can be outlined:
- The optimistic one is that if spot buyers manage to hold the $71,000 level, it may become a new strong support for a move toward the all-time highs and toward the local highs around $75,000.
- A more cautious scenario is that if the move were driven only by liquidations rather than real buying demand for Bitcoin, the price could quickly correct back downward once the fuel from forced purchases disappears.
$2.78 million in Shiba Inu (SHIB) leaves Singapore's Coinhako in one take
The final, but no less interesting news of this morning on the crypto market, was the transfer of 494 billion Shiba Inu (SHIB), worth about $2.7 million, from the hot wallet of the Singapore-based exchange Coinhaco to the address of smart market maker Cumberland DRW.
Transfers to Cumberland addresses are usually associated with OTC trading. This means that the asset is moved not for sale in the public order book of an exchange but as part of a private transaction between large counterparties.
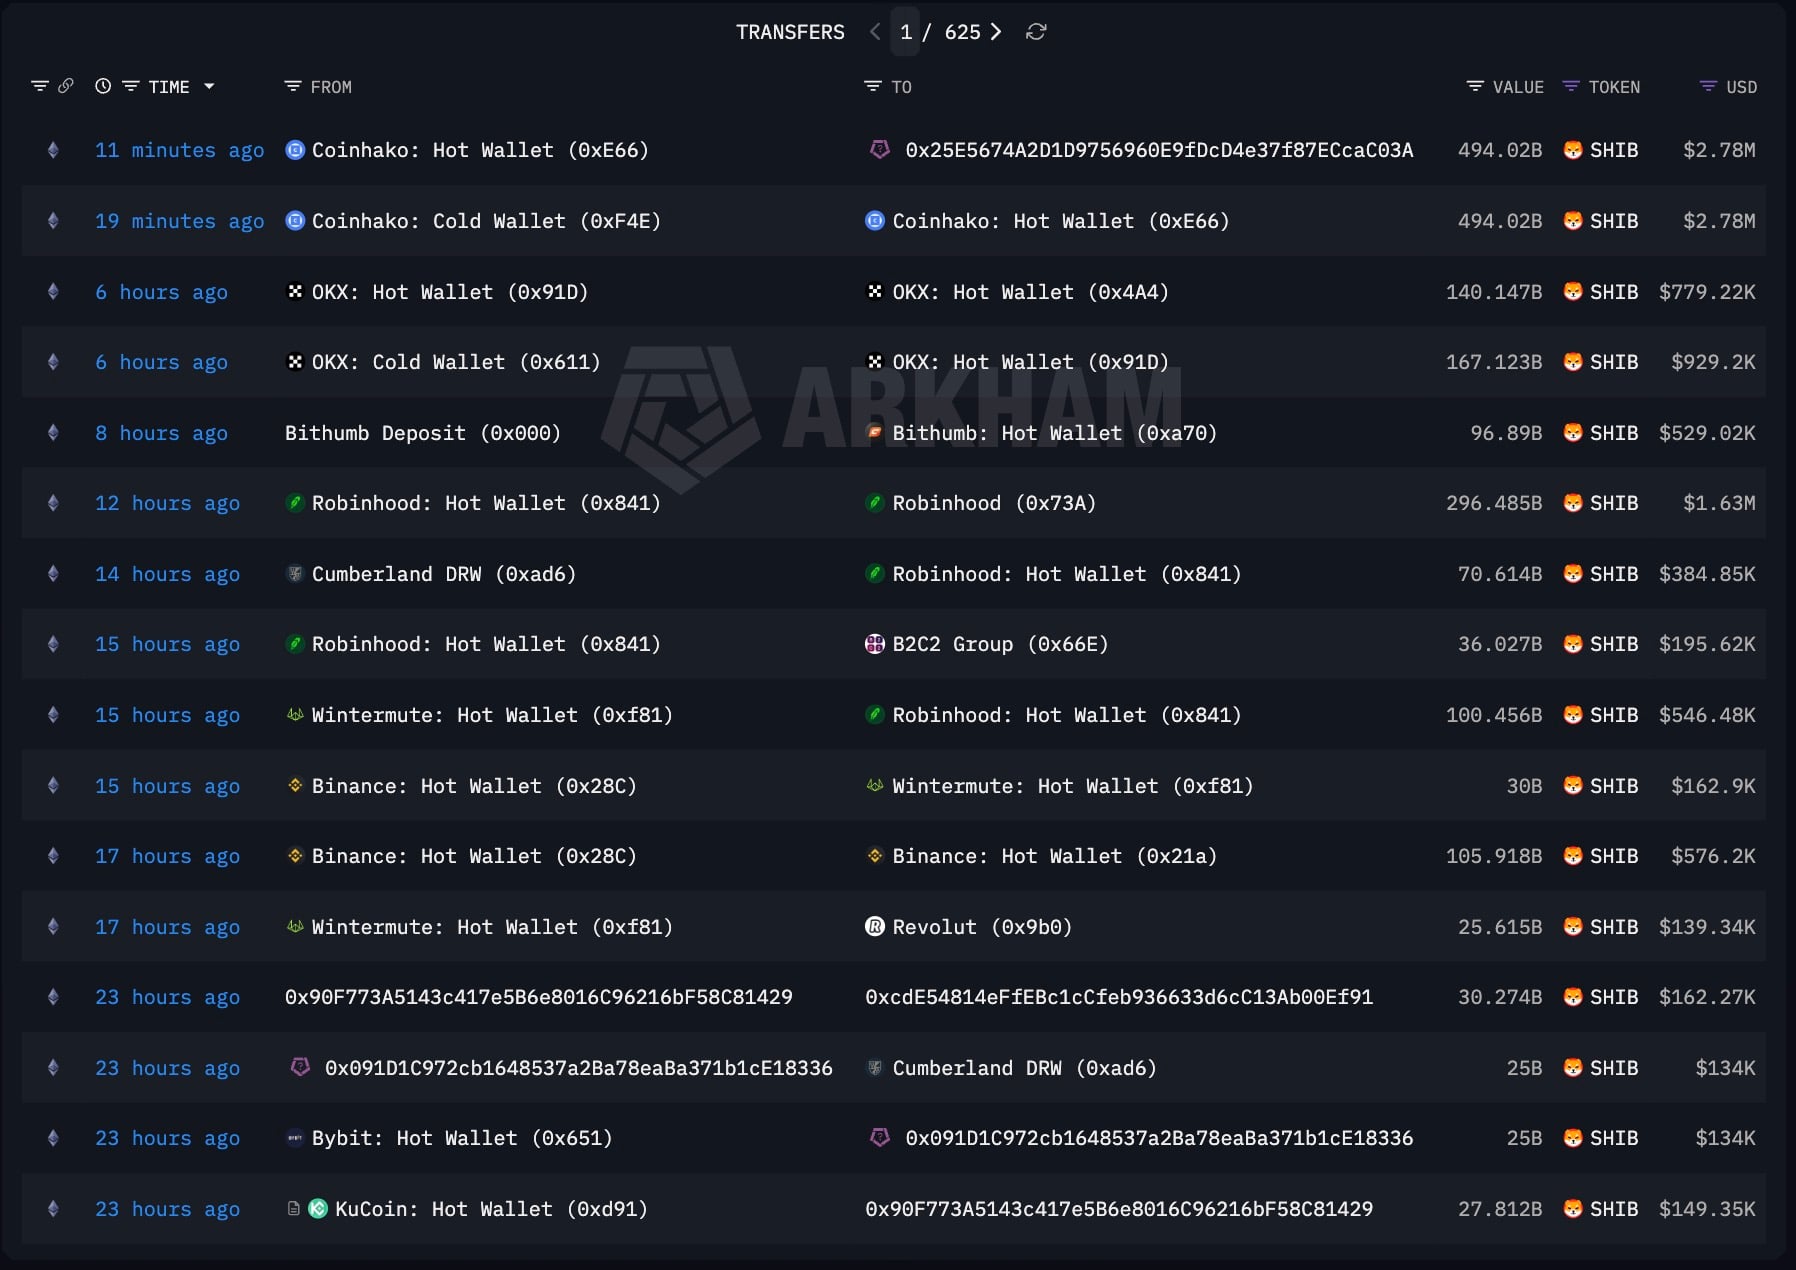
In the short term, such transactions rarely cause immediate price movements because they are executed outside the public market. However, they indicate a redistribution of large volumes of assets between exchange reserves and private portfolios.
Most likely, this operation represents a standard liquidity provisioning procedure or the execution of a large private order. What matters is that it confirms ongoing demand for SHIB from whales and their willingness to move tokens during periods of lower network activity to optimize transaction costs.
Crypto market outlook: How will CPI and Federal Reserve decisions impact crypto?
The cryptocurrency market remains in a state of high tension after a quiet period during the last three days, which was largely caused by instability in global events. It appears that the sentiment pendulum has swung back toward risk again.
Bitcoin acts as the locomotive here. While the rest of the market is waiting, Bitcoin dominance continues to rise, and any softening in political rhetoric appears to lead to renewed attempts to break key levels — which, at the moment, is $71,000.
At the same time, indicators on XRP, such as the Bollinger Bands, together with hidden movements in Shiba Inu, show that so-called smart money may already be positioning itself.
Ahead lie the CPI release and the Federal Reserve meeting on March 19. This will likely be a period when large players, including firms like Cumberland or ETF funds connected to Bitcoin and XRP, finalize their positioning ahead of volatility.
 Dan Burgin
 Vladislav Sopov