
Disclaimer: The opinions expressed by our writers are their own and do not represent the views of U.Today. The financial and market information provided on U.Today is intended for informational purposes only. U.Today is not liable for any financial losses incurred while trading cryptocurrencies. Conduct your own research by contacting financial experts before making any investment decisions. We believe that all content is accurate as of the date of publication, but certain offers mentioned may no longer be available.
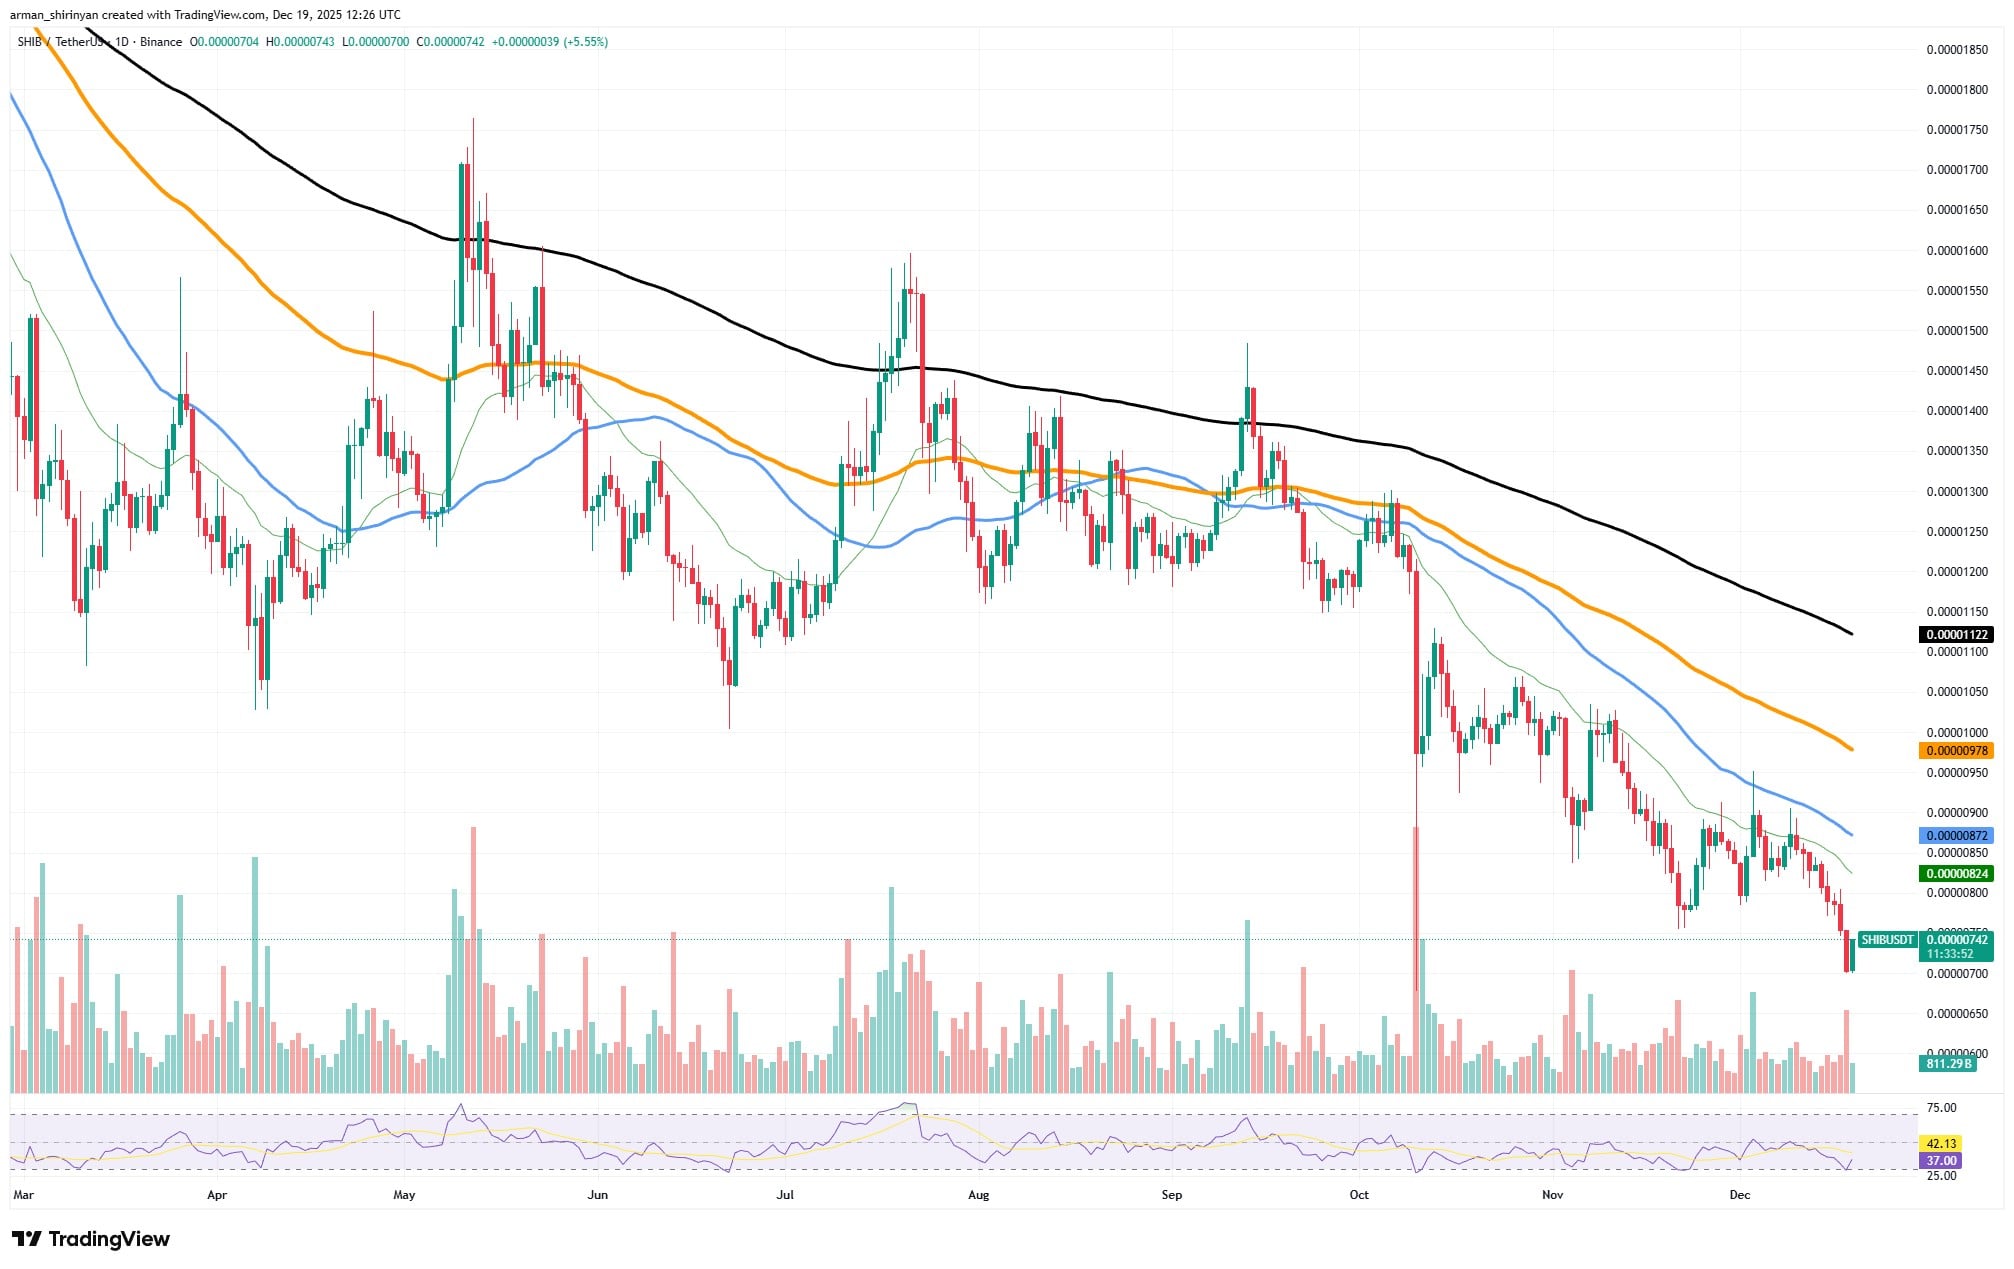
SHIB is currently trading below all significant moving averages on the daily chart, indicating that it is still deeply in a wider downtrend. The recent grind lower indicates that sellers continue to control the higher time frame, and the larger structure has not turned bullish.
Shiba Inu flows down
The downward momentum is slowing concurrently. The price is no longer cascading as it did during the previous sell-off, volatility is compressing and the RSI is trapped close to the lower range. This market is not yet in recovery mode — it is in stabilization mode.
In light of this, the futures data revealed a -131,522% imbalance on the 15-minute Shiba Inu Futures Flows, which at first glance appears to be utterly absurd. That figure raises questions right away because, according to mathematics, a move of -100% should already indicate a total wipeout.
How, then, does something surpass -100%?
The solution is less dramatic and simpler than it first appears. Price is not measured by that percentage. Change is being measured in relation to a very tiny baseline. Net flow values can quickly change from slightly positive to significantly negative over brief periods of time, such as 15 minutes.
Even a slight outflow can result in a percentage change that soars into ridiculous territory if the prior net inflow was nearly zero. The denominator was small, to put it another way.

The calculations performed as they always do. The flows table shows what actually took place. There was an abrupt negative net flow during the 15-minute window, as outflows greatly outpaced inflows. This does not imply that SHIB futures fell by 131,000%. It indicates that positioning changed dramatically in a brief period of time, most likely as a result of leveraged traders liquidating or closing long positions as the price stalled.
The open interest chart provides more context. Overall open interest has been declining, with sporadic short-lived peaks. This indicates that leverage is not being rebuilt, but rather being washed out. This flow event shows that short-term traders are leaving rather than long-term money coming in.
 Dan Burgin
 U.Today Editorial Team