
Disclaimer: The opinions expressed by our writers are their own and do not represent the views of U.Today. The financial and market information provided on U.Today is intended for informational purposes only. U.Today is not liable for any financial losses incurred while trading cryptocurrencies. Conduct your own research by contacting financial experts before making any investment decisions. We believe that all content is accurate as of the date of publication, but certain offers mentioned may no longer be available.

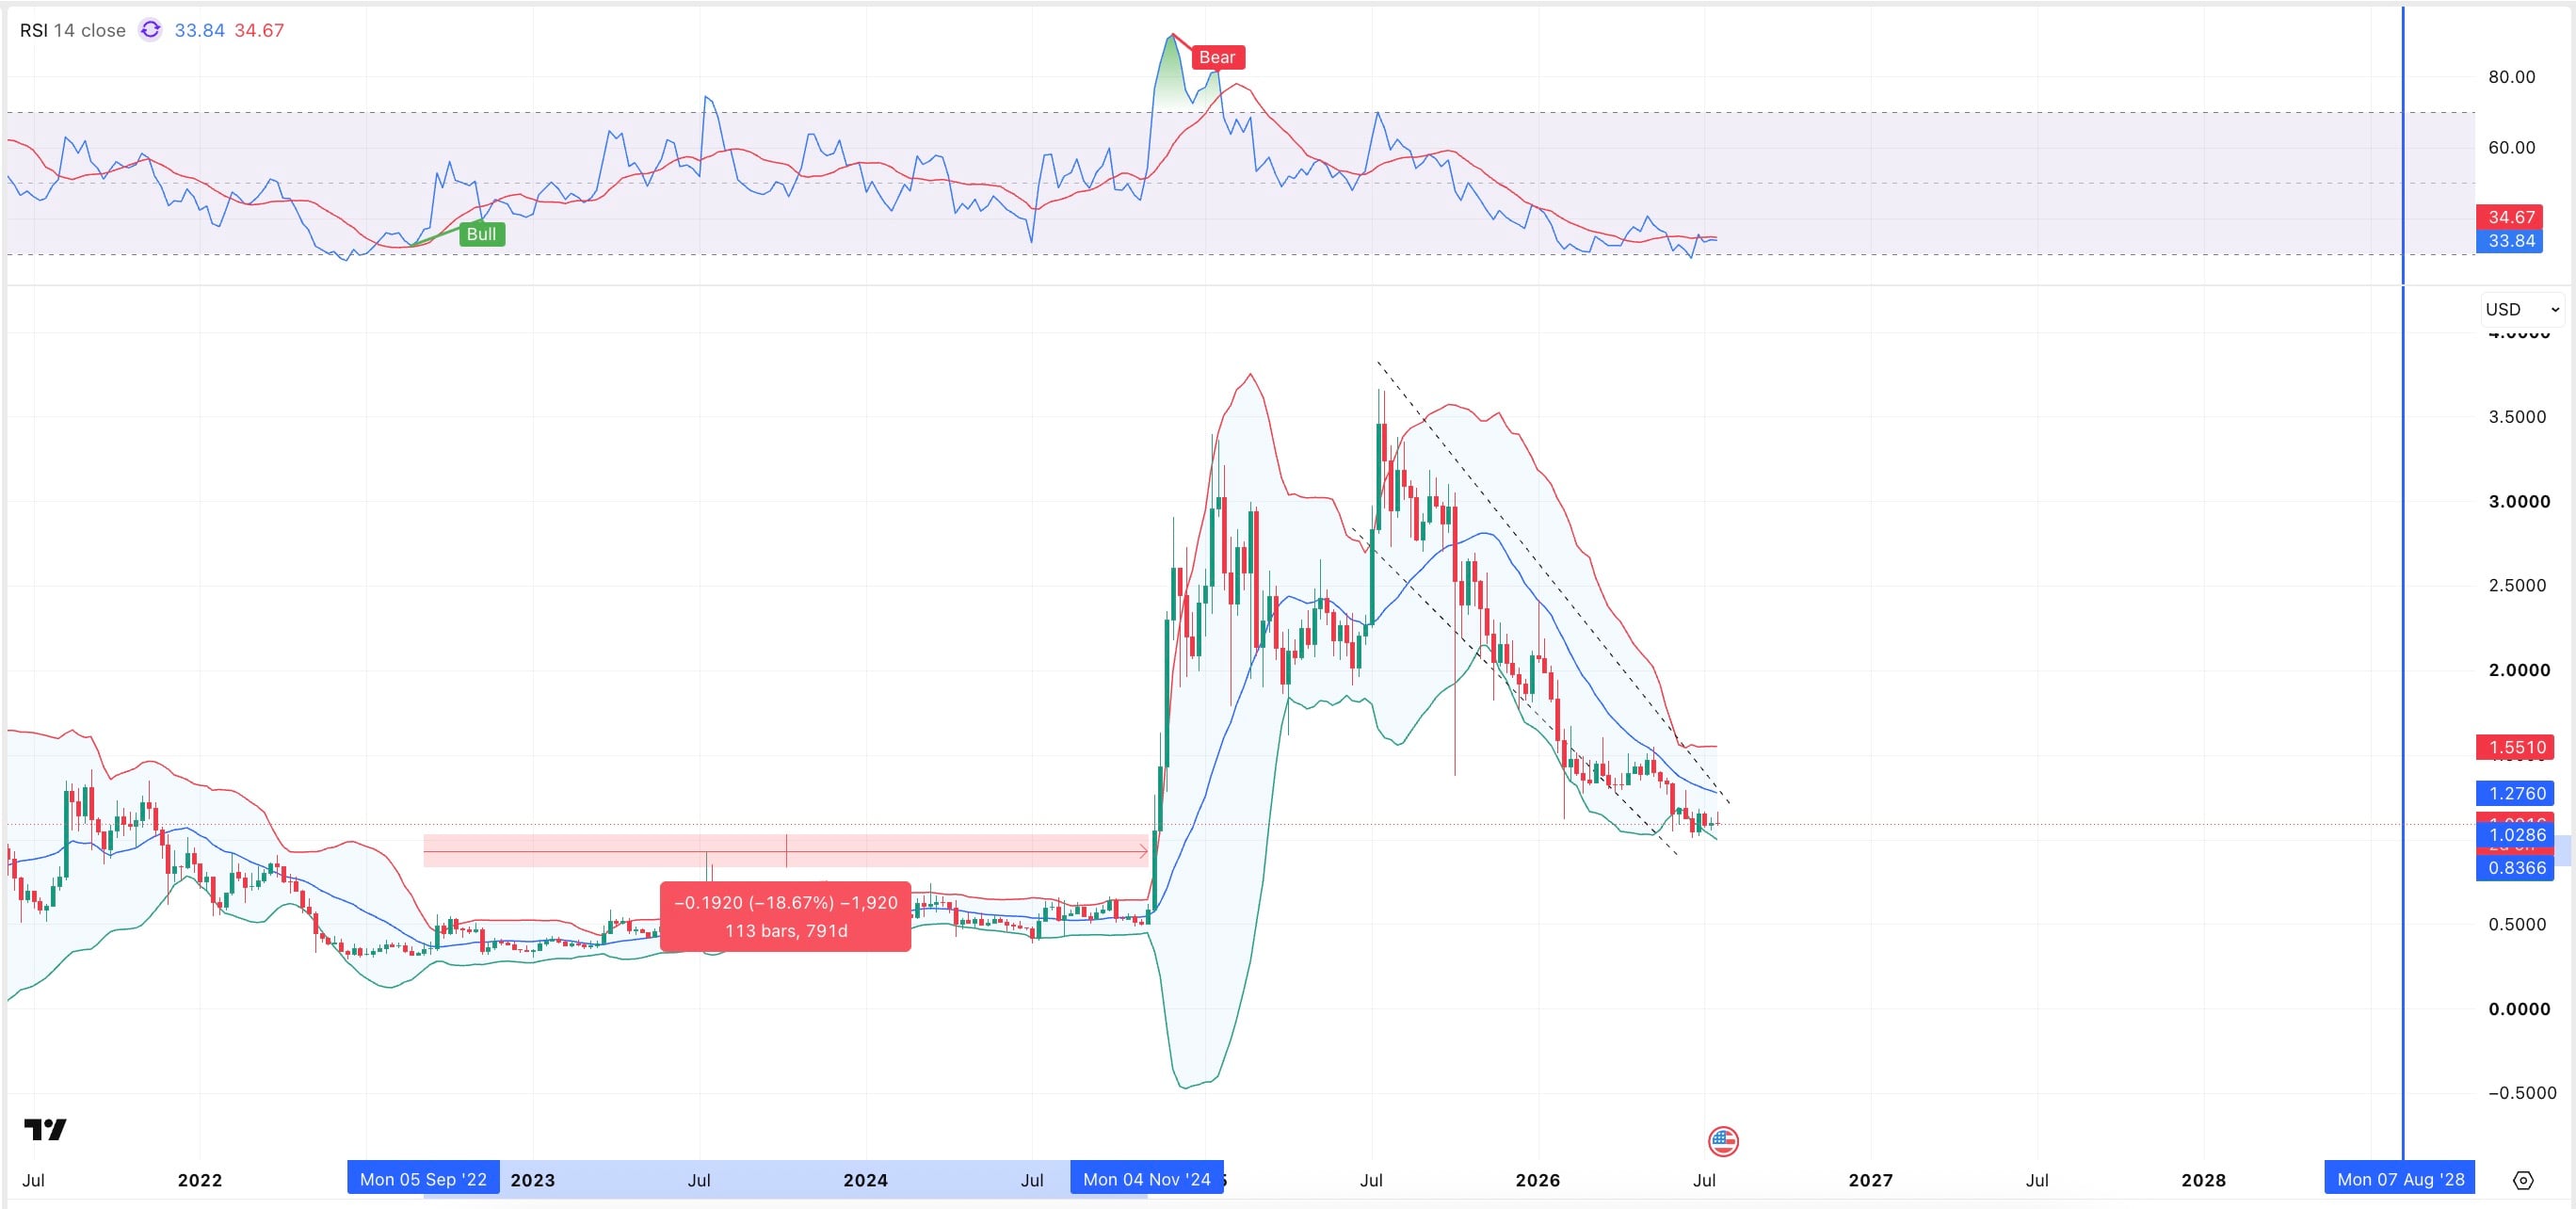
A unique situation has emerged in the XRP market: while Ripple continues expanding its business, the token itself risks falling into a deep two-year sleep. A fresh technical analysis based on Bollinger Bands via TradingView shows that the chart is now effectively projecting the previous accumulation cycle of 2022–2024.
The conclusion of the mathematical model is harsh — a breakout from the prolonged sideways trend is not expected until August 2028.
XRP price history repeats itself
The logic behind the long-term forecast is simple: XRP, like any other established cryptocurrency, tends to repeat its own cycles. Between 2022 and 2024, the token spent 791 days in deep accumulation, after which a powerful impulse pushed the price to a peak of $3.55, after which a gradual correction began.
Right now, XRP is trading within the $1.06–$1.10 range, while the Bollinger Bands are beginning to contract again on higher time frames. If the historical pattern repeats, the asset could face another two years of horizontal price action — dull and exhausting for speculators.
The current news environment clearly explains why the Bollinger Band model has a strong chance of materializing in practice, and institutional interest in U.S. spot XRP ETFs fading to a symbolic $2 million–$12 million per week is a stark proof of this scenario.
At the same time, the launch of the Ripple Mint platform for the RLUSD stablecoin, which has a market capitalization of $1.5 billion, reinforced the skeptical view — banks are adopting Ripple's infrastructure, but they do not need to purchase XRP itself for settlements.

The situation is further complicated by the political deadlock in the United States, where Polymarket currently places the probability of the CLARITY Act being passed this year at only 42%.
As a result, the current balance of power in the market comes down to two key scenarios:
- Bearish case: The absence of organic demand from banks, declining ETF inflows, and regulatory deadlock deprive the token of growth drivers, forcing retail investors to sell their holdings.
- Bullish case: Large wallets, or whales, are aggressively buying the supply sold by capitulating investors, forming a reinforced price floor ahead of a powerful technical Bollinger Band breakout.
As the market remains constrained by uncertainty and the absence of retail demand, XRP is entering another phase of long-term accumulation, and in the worst-case scenario, investors may have to remain patient until the end of summer 2028.
 Dan Burgin
 U.Today Editorial Team
