
Disclaimer: The opinions expressed by our writers are their own and do not represent the views of U.Today. The financial and market information provided on U.Today is intended for informational purposes only. U.Today is not liable for any financial losses incurred while trading cryptocurrencies. Conduct your own research by contacting financial experts before making any investment decisions. We believe that all content is accurate as of the date of publication, but certain offers mentioned may no longer be available.
The most recent spike in spot flows is a clear indication that XRP is about to enter a phase where short-term capital activity is beginning to matter more than its overall trend, and the same goes for Bitcoin and Shiba Inu — which are seeing substantial recoveries across the market
XRP's spot flow is back
In the last 24 hours, XRP’s spot flow increased by +233% over a one-hour period at some point; larger participants repositioning, whether for accumulation or distribution, is usually reflected in moves of that size. Which side of that equation is being played out, however, depends on the context.
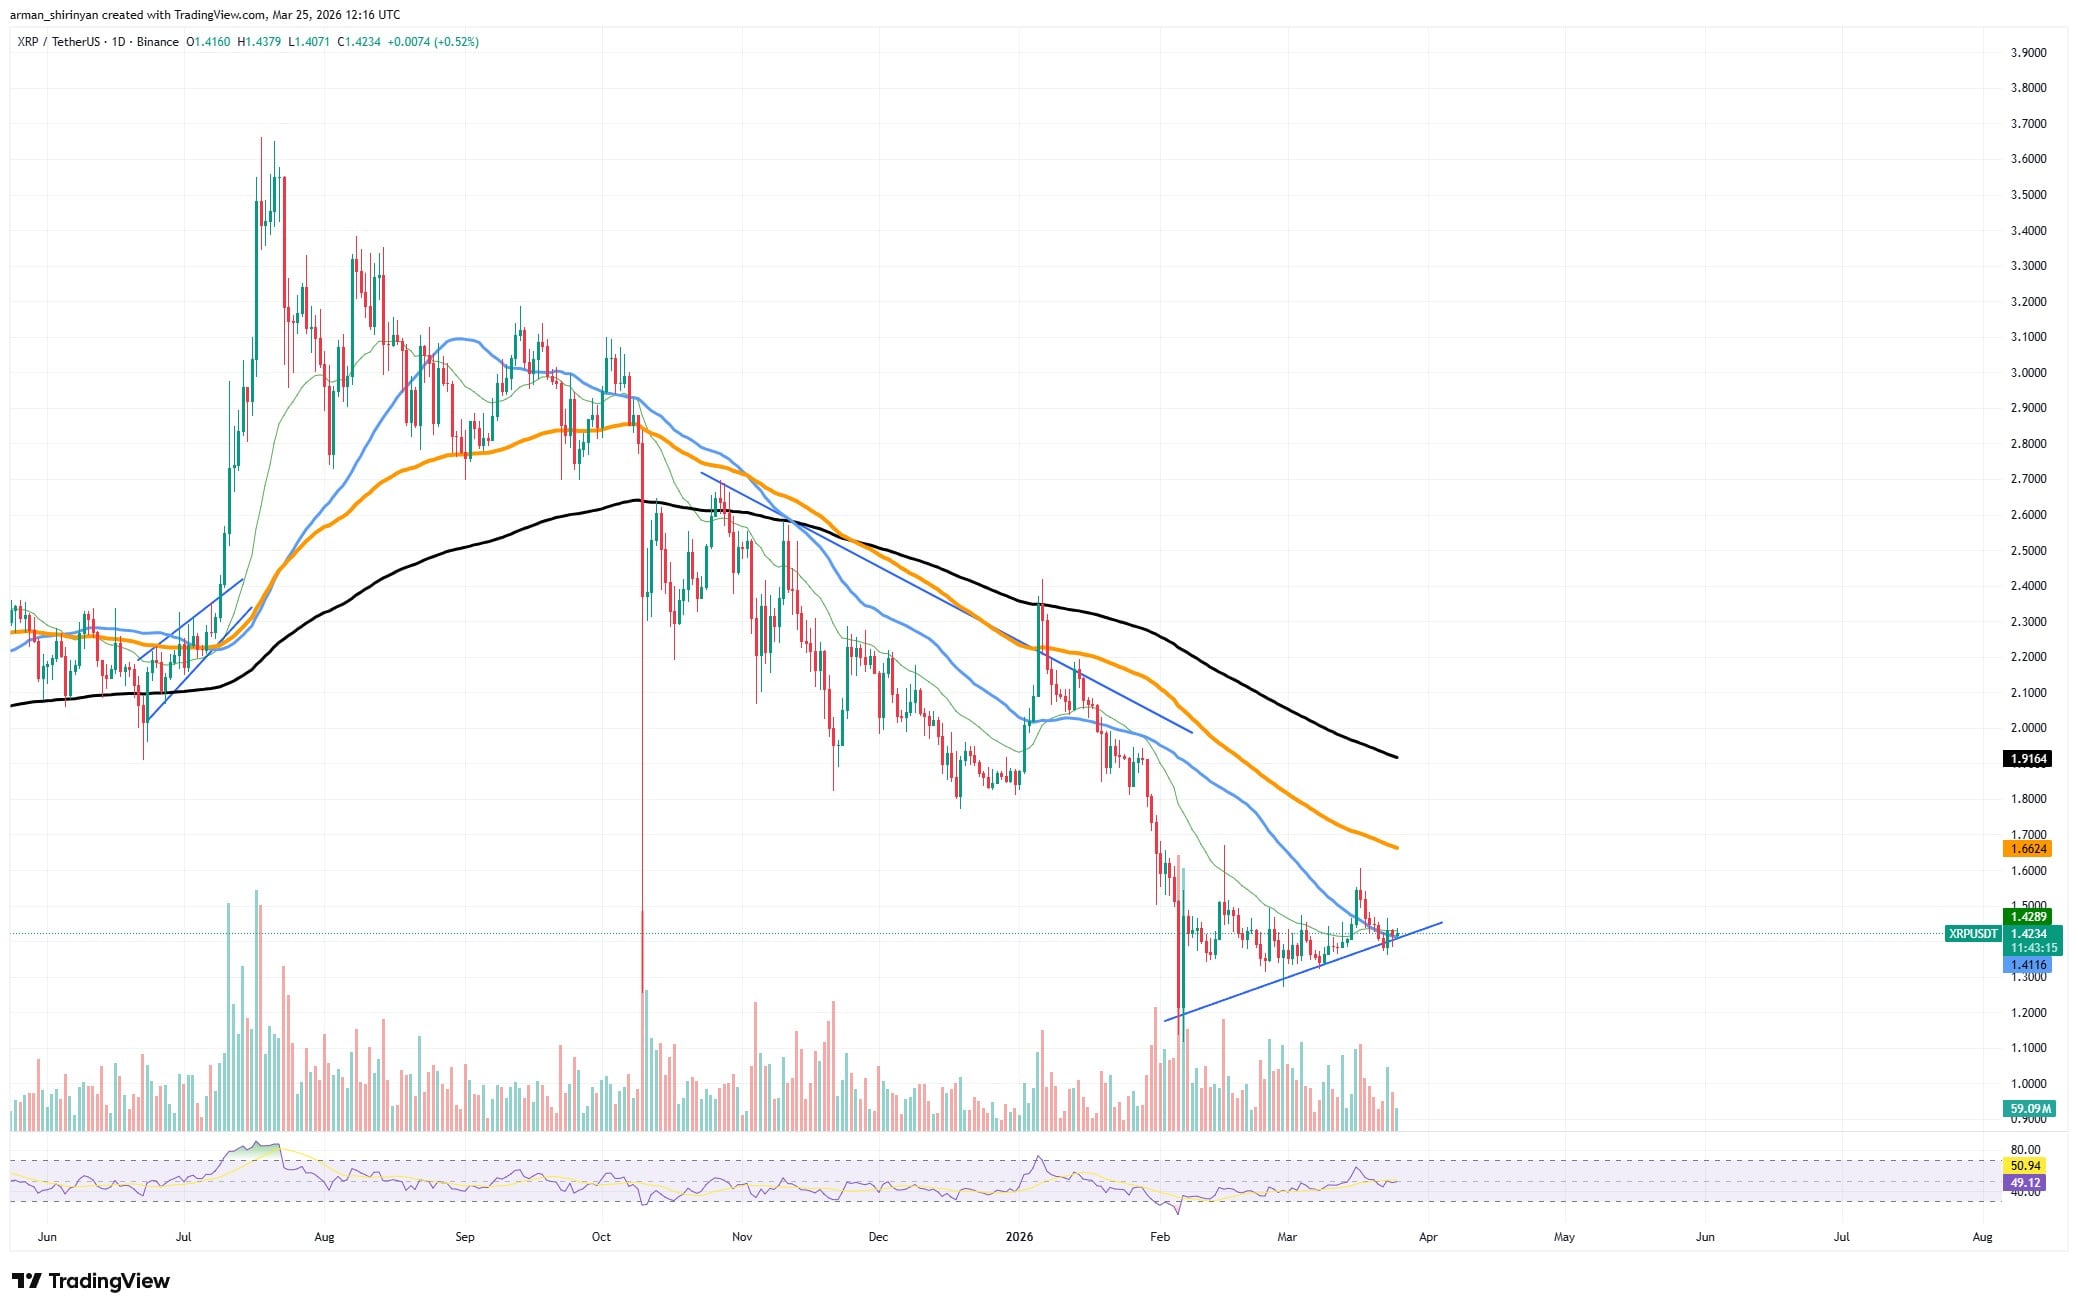
XRP is still in a wider downward trend on the price chart, trading below its major moving averages and finding it difficult to break the pattern of lower highs. Simultaneously, the asset has begun to form a short-term ascending structure with higher lows, indicating waning selling pressure. As a result, there is a conflict between the growing local strength and the macro bearish structure.
Spot flows recovering
Another layer is added by the increase in spot inflows. Increased spot flow is typically a better sign since it shows that money is coming into the market directly, as opposed to through derivatives. It suggests that the underlying asset is actually purchased or repositioned. That is bullish when considered alone.
However, if major holders are transferring assets to exchanges in order to sell into strength, inflows may also come before distribution. The timing of the flow increase in the current configuration corresponds with XRP testing local resistance. This makes it a pivotal moment.

In the event that the inflows indicate accumulation, XRP should start to break through surrounding resistance levels and try to recover the 50 EMA. That would support the theory that whales are preparing for a temporary rebound.
The interpretation quickly changes if the price does not react to the +233% spike. It implies that rather than raising prices, which is usually a sign of a bear market, the inflows are being absorbed as sell-side liquidity.
Bitcoin's future bleak
Technically speaking, Bitcoin is at a turning point, and the current trendline structure is more accurate than any narrative at defining its immediate future.
Bitcoin is currently trying to stabilize following a protracted correction that drove it well below its important moving averages. The price is still below the 50, 100 and 200 EMAs, which are all sloping downward and serving as dynamic resistance, and the overall structure is still bearish. That aspect is still the same.
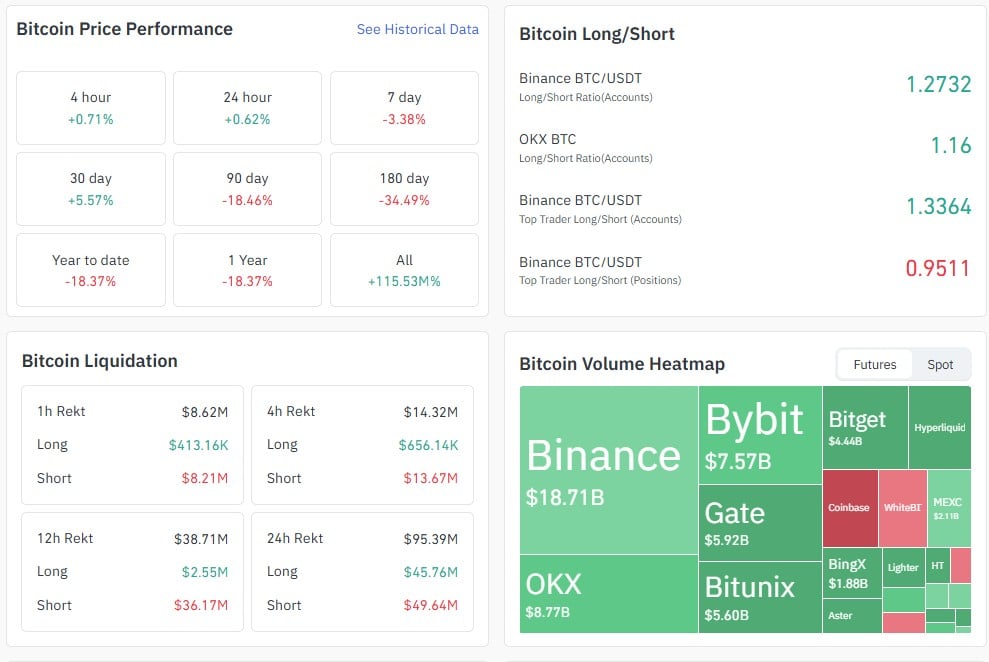
The way people behave when it comes to local support has changed. After its recent bottom, Bitcoin has begun to form higher lows along a rising trendline. Following months of lower lows, this is the first positive change in structure, indicating that selling pressure is no longer as strong. The price is now being absorbed on dips rather than falling.
Bitcoin moving through
BTC is simultaneously contracting between the moving averages, rising support and falling resistance. This results in a tightening range, which is short-lived. This structure’s breakout direction will probably determine the next significant action.
The market may enter a recovery phase if Bitcoin is able to maintain the rising trendline and surpass the adjacent resistance cluster, especially the 50 EMA. Although a complete trend reversal would not be confirmed right away, it would change momentum and pave the way for testing higher resistance zones.

The interpretation is simple in the event that the trendline breaks. The market would probably return to lower support levels after the recent higher lows were invalidated, possibly extending the wider downward trend.
Investors should watch for confirmation rather than making assumptions. The trendline is functioning as a distinct line.
Shiba Inu finally breaks through
Moving averages have consistently rejected SHIB, which has been trading in a clear downtrend for months. Specifically, the 50 EMA has served as the initial line of dynamic resistance, limiting each attempt at a recovery and strengthening the bearish structure.
Now, that dynamic is being questioned. Instead of being rejected right away, the price is repeatedly trying to break through the 50 EMA, as it has begun to compress beneath it. This shift in behavior is significant because it indicates a decline in sell-side control.
Shiba Inu's new range
SHIB is forming tighter consolidation with slightly higher lows, rather than abrupt sell-offs, indicating that buyers are progressively absorbing supply. The 100 EMA is the next logical barrier if the 50 EMA is decisively broken and the price establishes acceptance above it.
Moving averages serve as a ladder of resistance on trending markets during downtrends. When the closest level is reclaimed, the price usually moves toward the next level where sellers had intervened.
 Dan Burgin
 U.Today Editorial Team