Disclaimer: The opinions expressed by our writers are their own and do not represent the views of U.Today. The financial and market information provided on U.Today is intended for informational purposes only. U.Today is not liable for any financial losses incurred while trading cryptocurrencies. Conduct your own research by contacting financial experts before making any investment decisions. We believe that all content is accurate as of the date of publication, but certain offers mentioned may no longer be available.
The cryptocurrency XRP has likely found its bottom at around $1.15, suggesting the worst is finally behind. However, technical analysis of the weekly chart shows that it is still too early to celebrate, as token holders may be facing an 800-day sideways drift - all the way until the end of 2027.
Data from TradingView confirms that the primary signal of a 2-year flat market is hidden on the weekly timeframe, where the four-year macrocycle makes the 2022 setup and the current 2026 structure look almost identical.

Exactly four years ago, the Bollinger Bands narrowed in the exact same manner, while the Relative Strength Index (RSI) slowly settled near the bottom. This specific combination of factors indicates that volatility has been fully suppressed, signaling that the market has officially entered an accumulation phase.
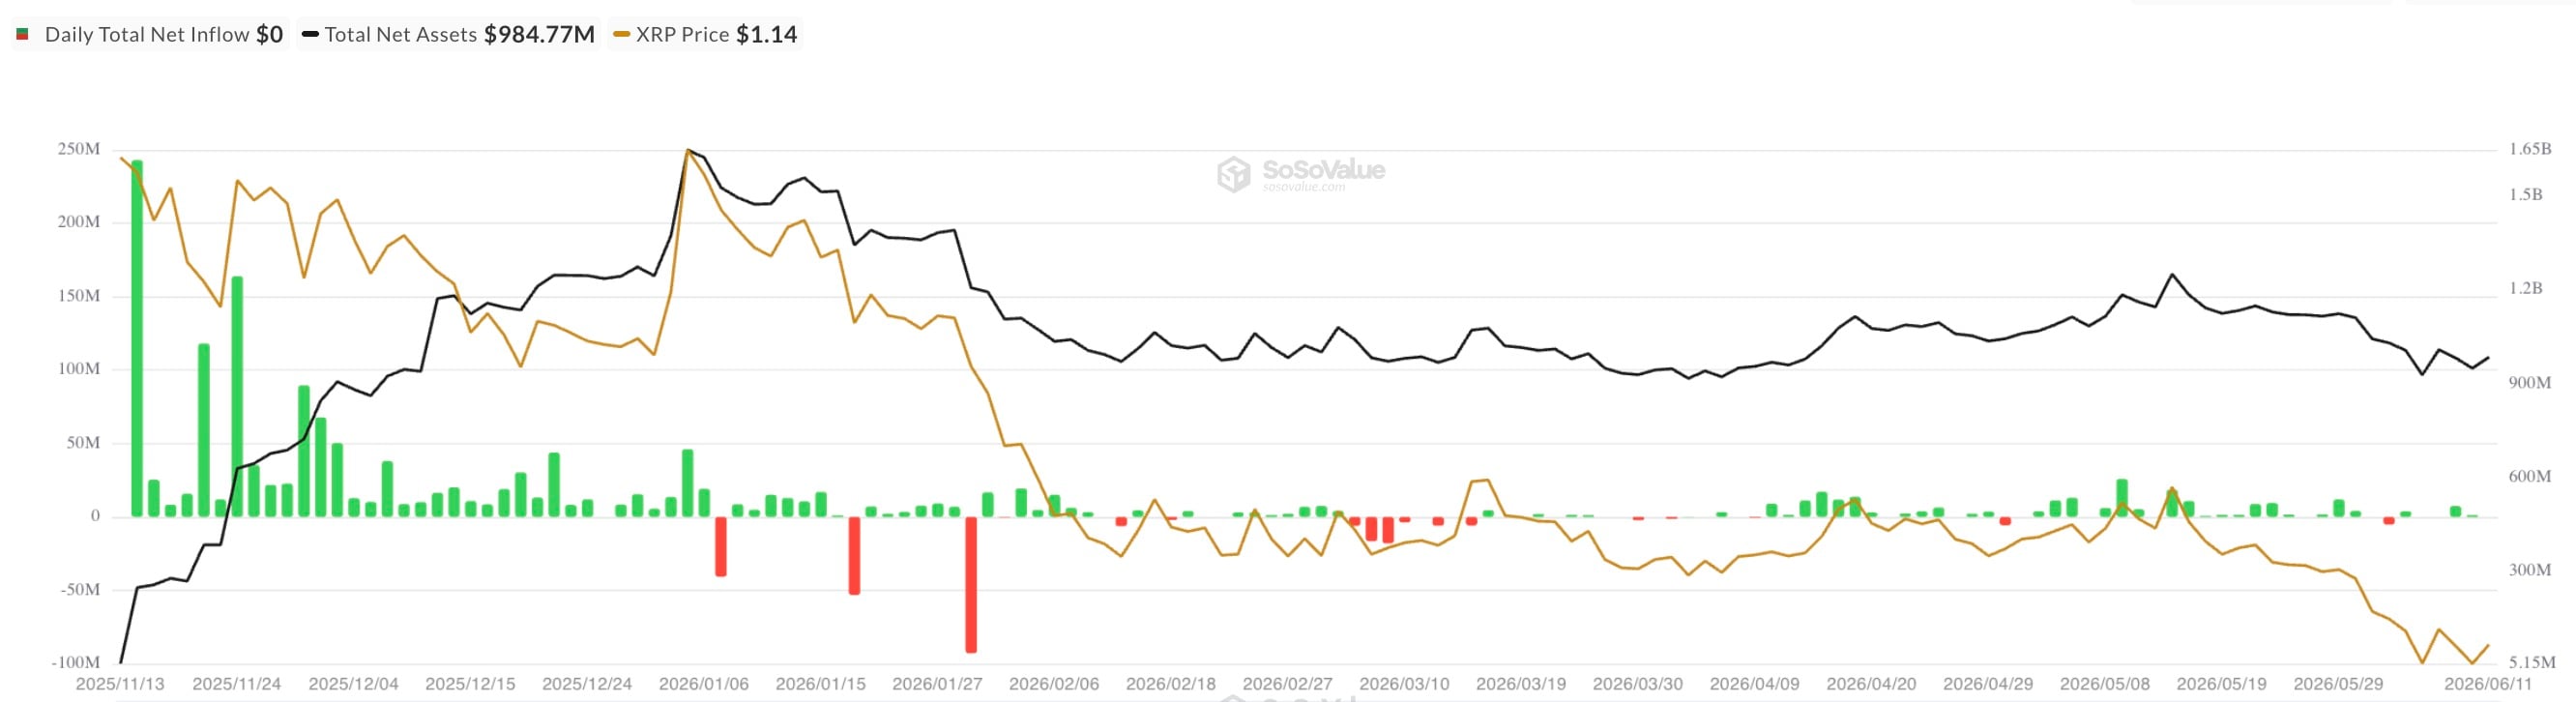
While retail waits, spot ETFs vacuum up $1.4 billion in XRP
At the same time, a unique paradox is forming as while retail traders are bored, institutions have arranged a hidden buying campaign. According to reports from SoSoValue, cumulative net inflows into U.S. spot XRP ETFs have exceeded $1.434 billion. Funds such as Franklin Templeton's XRPZ ETF are recording multimillion-dollar inflows, while May 2026 became the strongest month of the year in terms of capital raised.

More to it, every new week, the media space rewards investors with loud headlines about how major banks such as Bank of America, payment giants such as Mastercard, and Ripple are launching new pilots or announcing another stage of XRP Ledger integration for their cross-border tasks.
However, because mass speculation among ordinary traders is still absent, this is not yet enough to launch an immediate bullish rally.
Where will XRP be in 2027?
Over the next two and a half years, the coin will most likely continue to move monotonously within the range of $1.15 to $2.00, gradually absorbing institutional billions. XRP may return to full-scale growth toward $3.50 and higher closer to 2030, when the next major four-year rise in the crypto market begins.
A move above $10.00, however, will become possible only when the liquidity accumulated by funds collides with mass recognition of XRP as the main global standard for interbank settlements.
 Dan Burgin
 U.Today Editorial Team