Disclaimer: The opinions expressed by our writers are their own and do not represent the views of U.Today. The financial and market information provided on U.Today is intended for informational purposes only. U.Today is not liable for any financial losses incurred while trading cryptocurrencies. Conduct your own research by contacting financial experts before making any investment decisions. We believe that all content is accurate as of the date of publication, but certain offers mentioned may no longer be available.
By the end of the first week of March, a classic situation appeared on the XRP price chart that market participants call a Bollinger Bands squeeze, as presented by TradingView.
Bollinger Bands measure volatility. When the upper and lower boundaries move as close to each other as possible, as seen now on the right side of the chart, it signals extremely low volatility. The logic of the market is that periods of low volatility are always followed by periods of high activity. The more the bands compress, the stronger the following impulse usually becomes.
How CPI and FOMC in March could impact XRP price
It is visible that the price is trapped in a narrow range, around $1.32-$1.46 per XRP. This is the classic calm before the storm. A similar compression, for example, led to a rapid increase in the price of XRP in January this year, when the price rose by more than 25%.
However, it is important to remember that a breakout from the squeeze can occur in either direction, upward or downward. Right now the price is located very close to the middle line. On the daily chart, consolidation above it would be a bullish signal, while consolidation below it would be bearish.
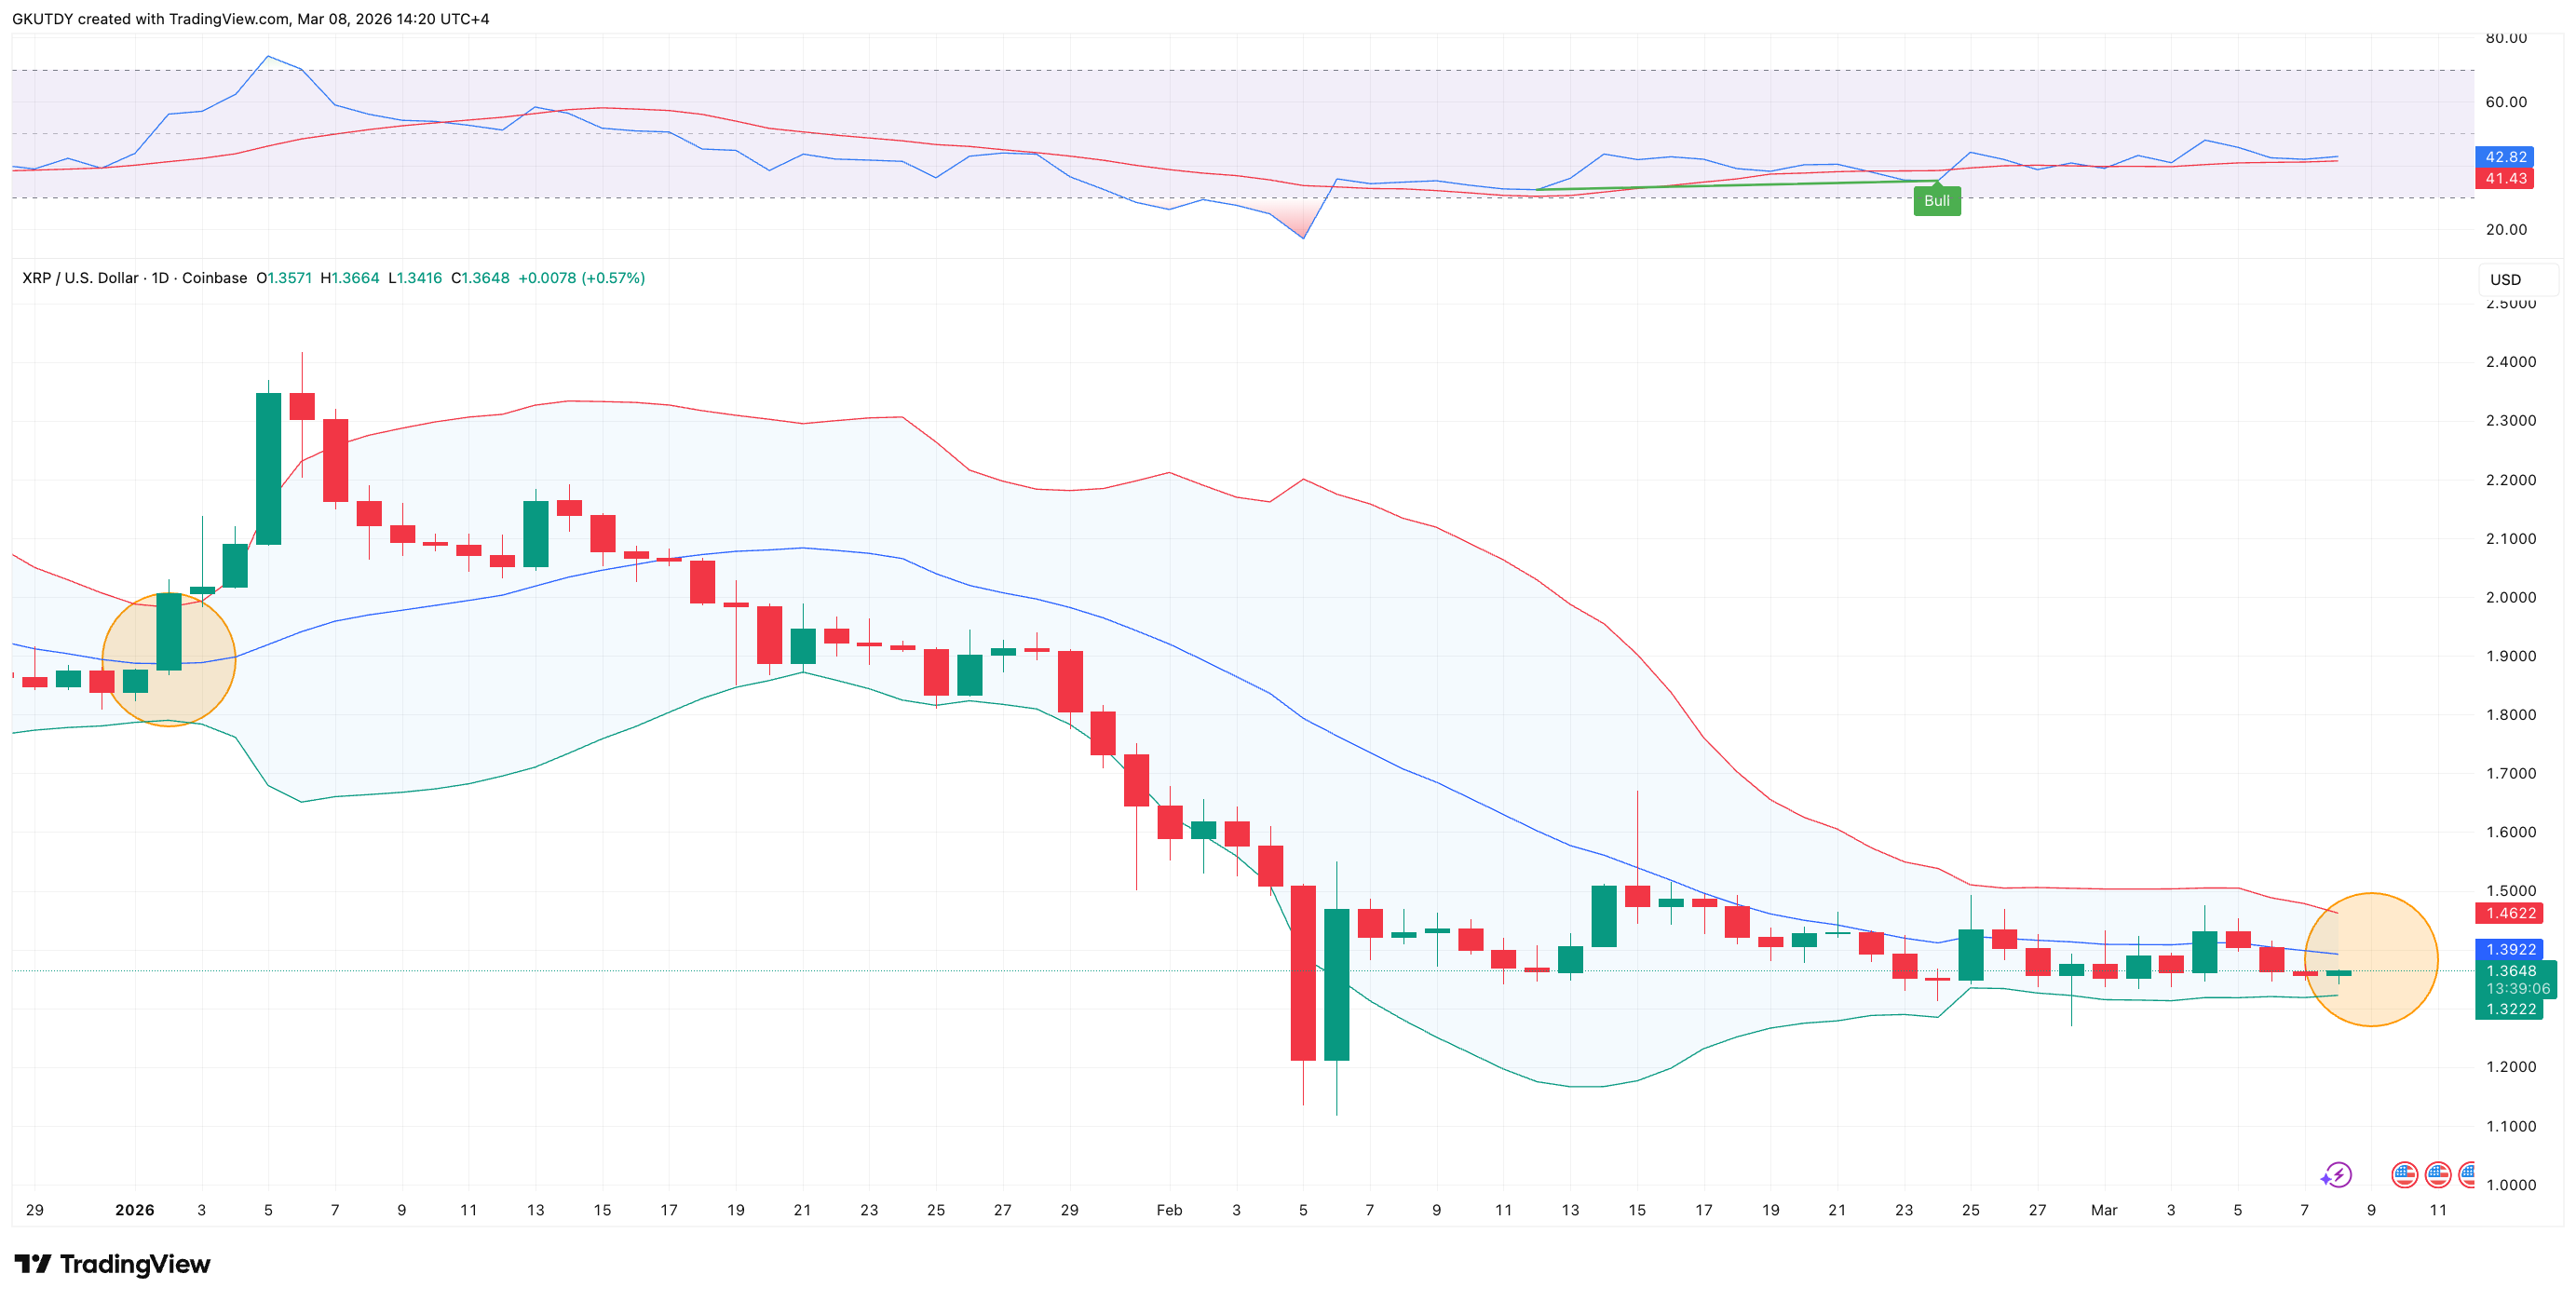
At the same time, the Relative Strength Index (RSI) indicator is in a neutral zone, which means the asset is neither oversold nor overbought. This means there is room for movement in both directions.
It is also interesting that this Bollinger squeeze is forming just as potential triggers approach. The FOMC decision on March 17-18 and the February CPI release on March 11 are extremely important macroeconomic events. These events may become the trigger that temporarily brings volatility back to XRP and the broader cryptocurrency market.
What can be expected in the near future is a rapid increase in trading volume and a breakout of the price beyond the current narrow corridor.
Target levels for XRP right now are the $1.60 area and above in case of an upward breakout. If the breakout occurs downward, support is located around the $1.10-$1.20 range.
 Dan Burgin
 U.Today Editorial Team