Disclaimer: The opinions expressed by our writers are their own and do not represent the views of U.Today. The financial and market information provided on U.Today is intended for informational purposes only. U.Today is not liable for any financial losses incurred while trading cryptocurrencies. Conduct your own research by contacting financial experts before making any investment decisions. We believe that all content is accurate as of the date of publication, but certain offers mentioned may no longer be available.
The XRP token started the final month of spring with a local uptick, gaining +2.1% in the first day. Despite the positive start and trading around $1.39, the technical picture on the monthly timeframe indicates that the path to the '$2 dream level' will be associated with overcoming serious resistance.
The current chart by TradingView shows a big gap to key trend indicators. The price remains well below the Bollinger Bands middle line, which is located at $2.03. To simply return to this mid-term baseline, XRP needs to demonstrate a 45% increase from current levels.
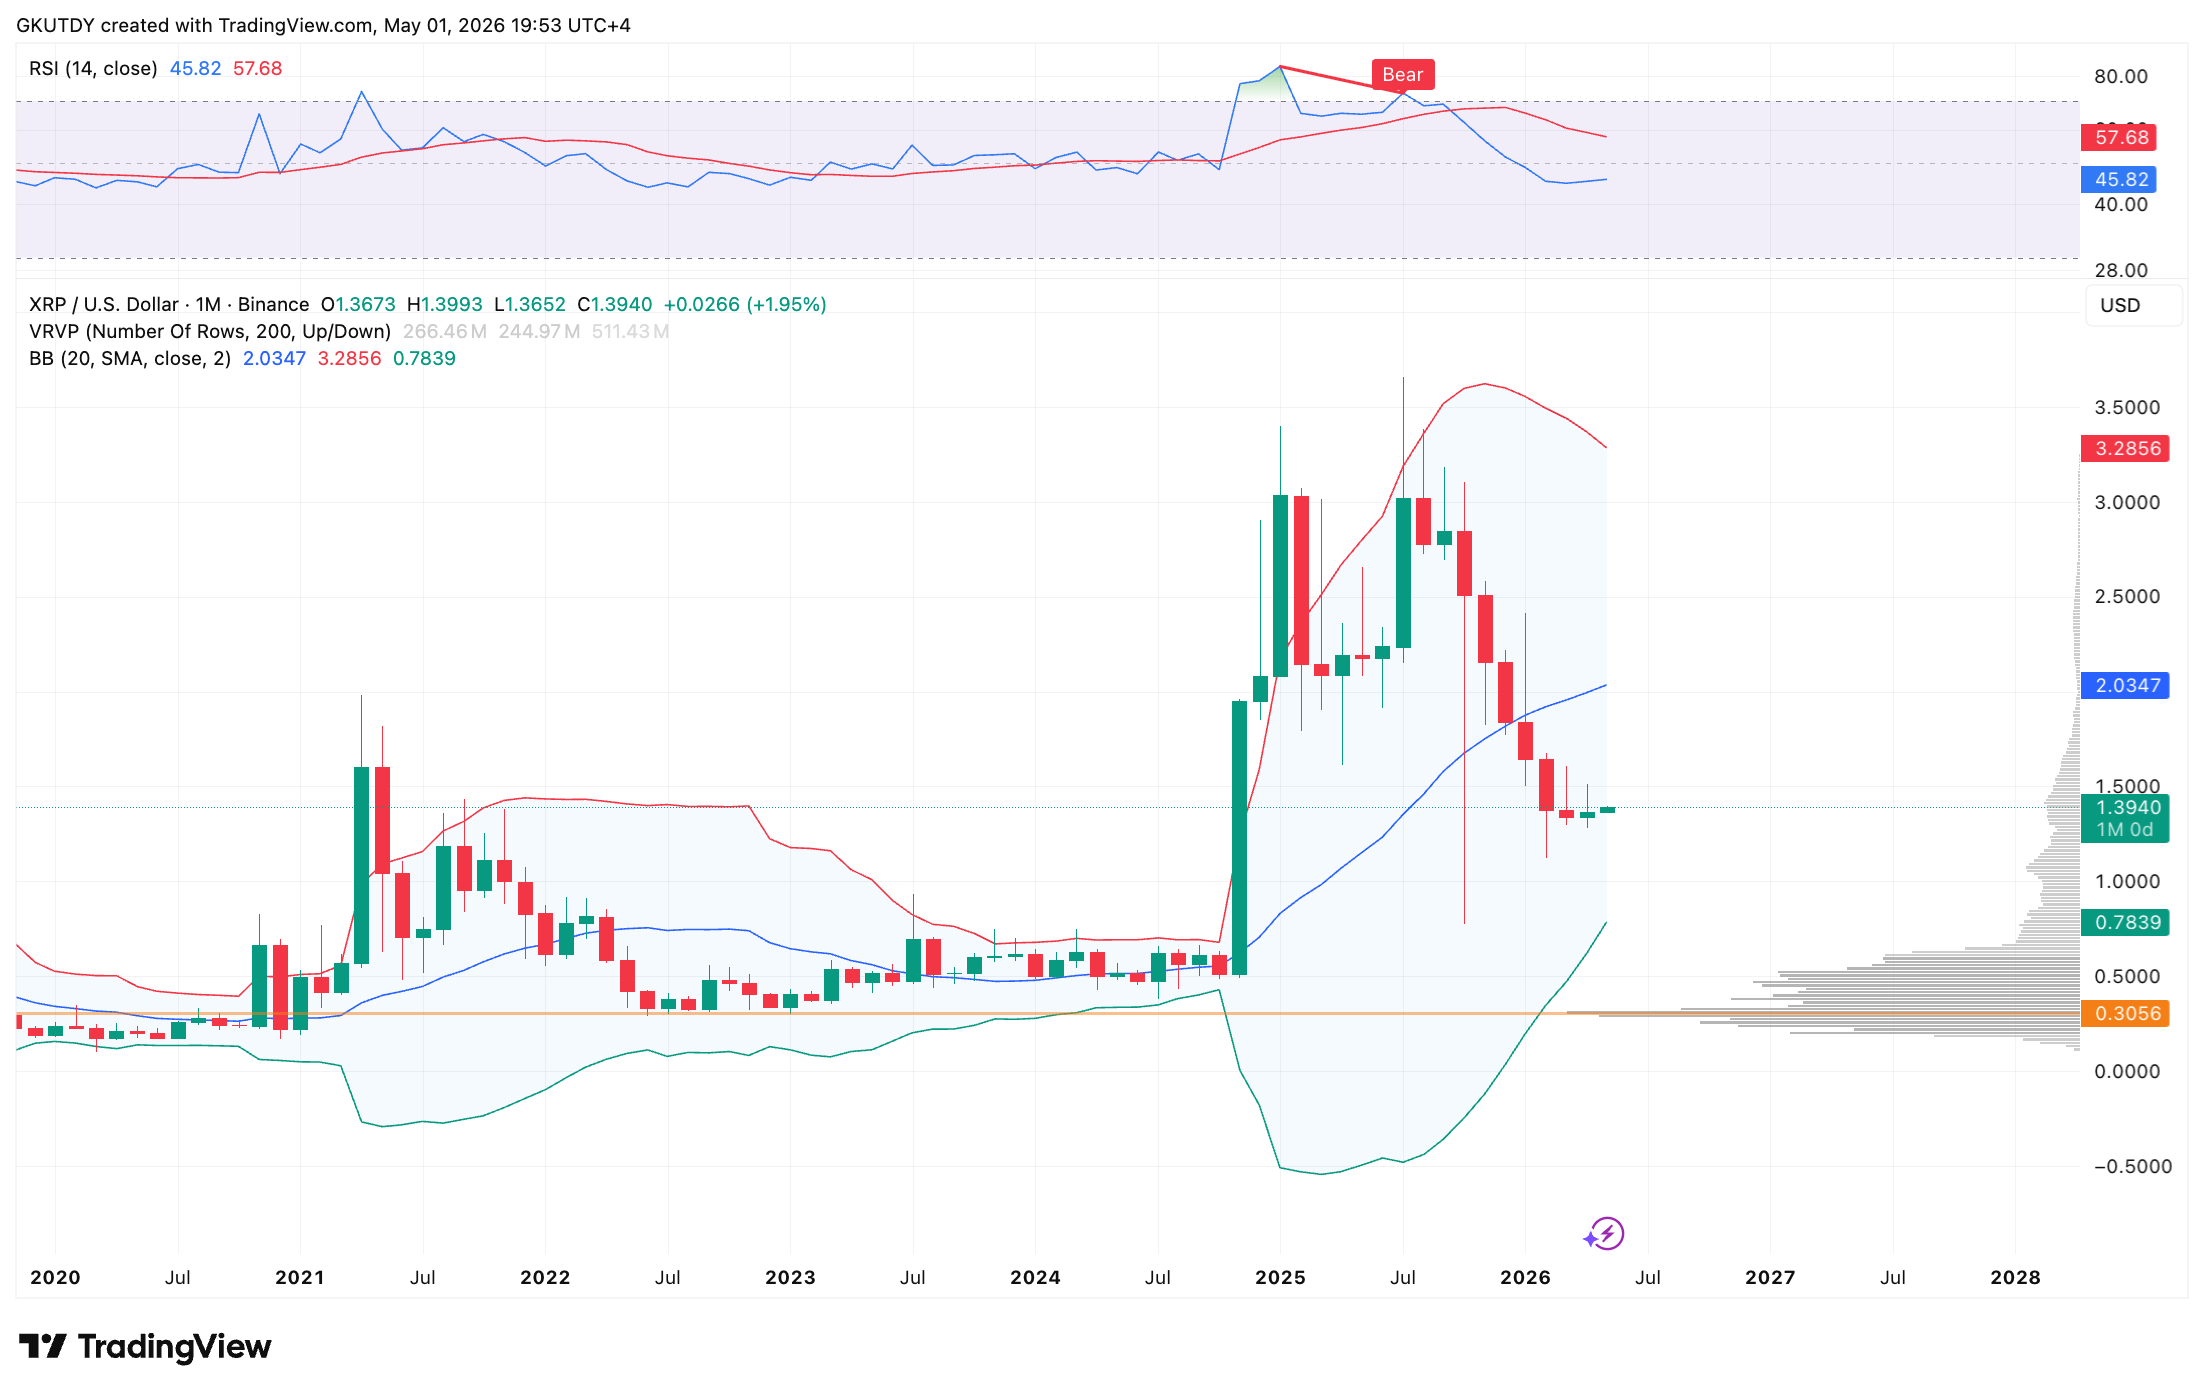
The Relative Strength Index stands at 45.85, which confirms the absence of overbought conditions and the presence of "room" for upward movement. However, current volumes are still insufficient to reverse the global downward vector.
Inside May's 23% bullish trend that makes $2 XRP target possible
The main argument in favor of growth by the end of the month remains the token's historical performance. May traditionally ranks among the most successful months for XRP, according to CryptoRank.
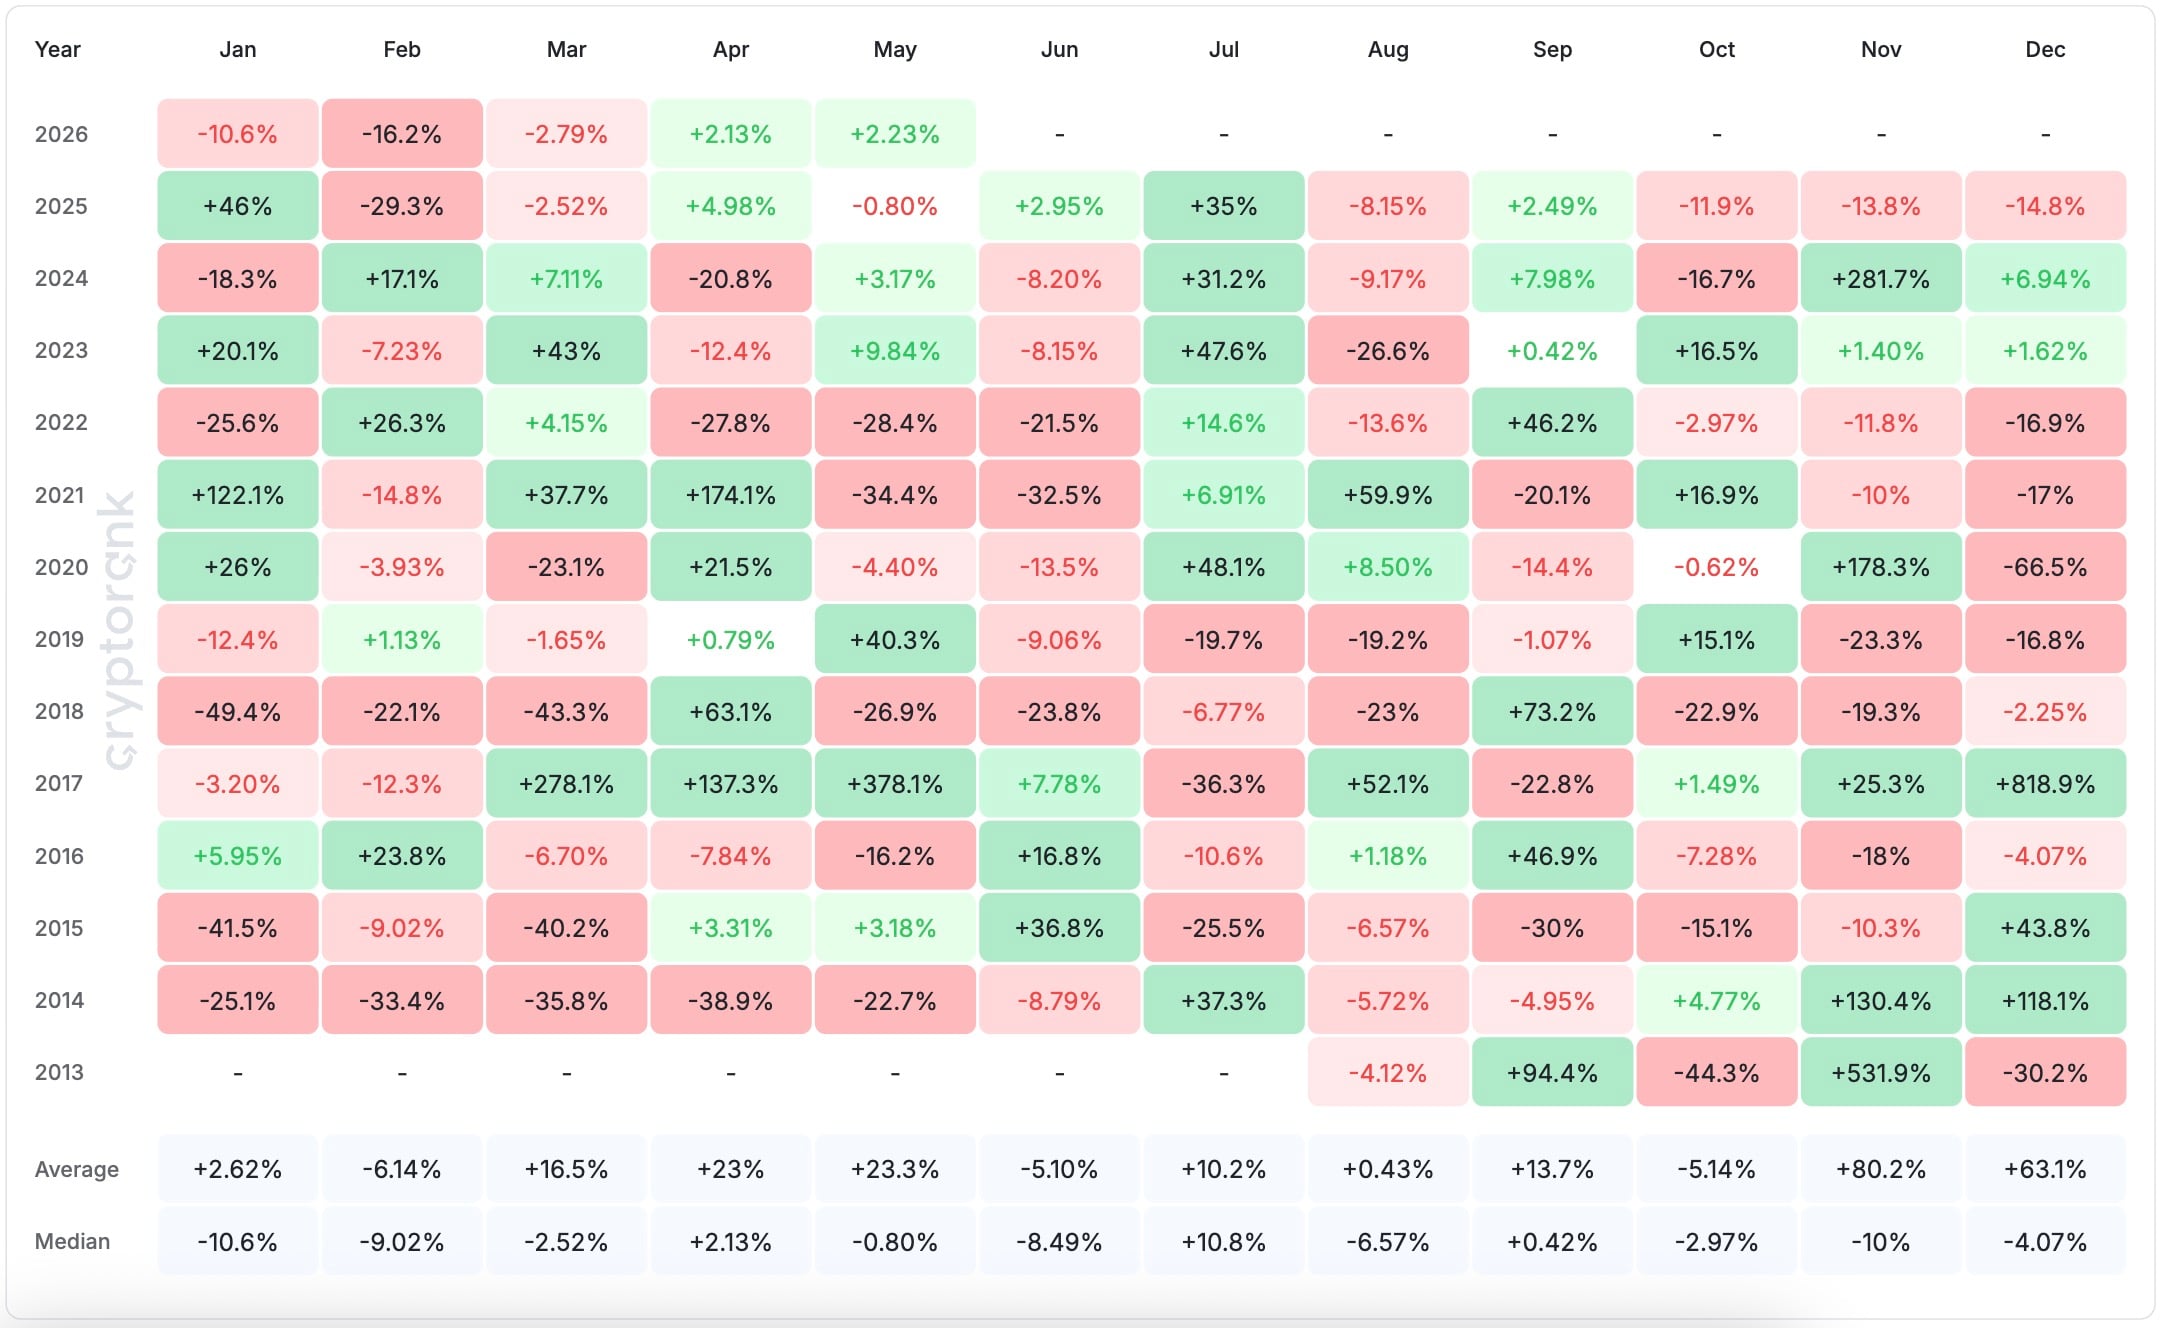
Over the past 13 years, the average gain in May has been +23.3%. If XRP follows this statistical scenario, by June the price may consolidate in the $1.70-$1.75 range, bringing it close to testing the key middle line at $2.03.
The current rise on the first day of the month coincides with expectations of new financial instruments launching. The main focus is on May 7, the date of listing leveraged XRP ETFs by GraniteShares, to see if the influx of volatility during this period can set the trend direction for the second half of the month.
The green start of May is a meaningful signal of recovery, especially considering that the 2.1% gain equals the entire result of April, but the $2 level remains an ambitious target. Achieving it will require not only historical inertia but also a fundamental breakout above the resistance zone at $1.50.
 Dan Burgin
 U.Today Editorial Team