Fear, Uncertainty and Doubt – that’s how a lot of mainstream media outlets depict the current state of the blockchain environment, yet fresh data proves otherwise.
A recent study conducted by the Cambridge Centre for Alternative Finance shows the number of verified cryptocurrency users jumped from 18 million last year to 35 million in 2018. According to the same study, the number of cryptocurrency accounts has climbed from 85 million in 2017 to 139 million in 2018. Seems like those people don’t have any fear, uncertainty or doubt whatsoever!
Chart Analysis – BTC/USD

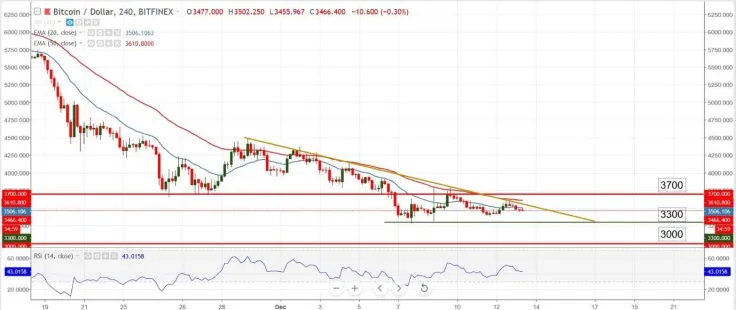
ALT: BTC/USD chart
Bitcoin is down more than one percent for the last 24 hours and almost 10% for the last 7 days, currently trading at $3,472 on Bitfinex. The pair is still trading below a bearish trend line and the two Exponential Moving Averages (20 and 50) are still crossed bearish (i.e. red above blue).
If we are to see any type of bullish behaviour, the first hurdle is the trend line seen on the 4-hour chart above, which if broken will likely spark additional buying interest and will probably take the price closer to $3,700. A key level is also $3,500, which may turn into support if broken to the upside.
Support zone: 3400 (minor) followed by 3300
Resistance zone: bearish trend line followed by 3700
Most likely scenario: retest of 3300 area (we are in a downtrend, so we favour the short side)
Alternative scenario: break of trend line without momentum
 Gamza Khanzadaev
 Caroline Amosun
 Godfrey Benjamin
 Tomiwabold Olajide