

Disclaimer: The opinions expressed by our writers are their own and do not represent the views of U.Today. The financial and market information provided on U.Today is intended for informational purposes only. U.Today is not liable for any financial losses incurred while trading cryptocurrencies. Conduct your own research by contacting financial experts before making any investment decisions. We believe that all content is accurate as of the date of publication, but certain offers mentioned may no longer be available.

After failing to sustain multiple attempts at recovery throughout July, Shiba Inu is still struggling under intense bearish pressure, with the asset trading close to $0.0000041. SHIB has been firmly in a long-term downtrend for the majority of 2026, as evidenced by the chart's distinct pattern of lower highs and lower lows.
The break from a rising channel that had sustained price action between March and May is among the most noteworthy developments. SHIB fell sharply after losing that structure's lower boundary, and it hasn't been able to recover any significant moving averages since. The 50-day EMA is still above $0.0000045, and the 100-day and 200-day averages are significantly higher, supporting the bearish market structure.
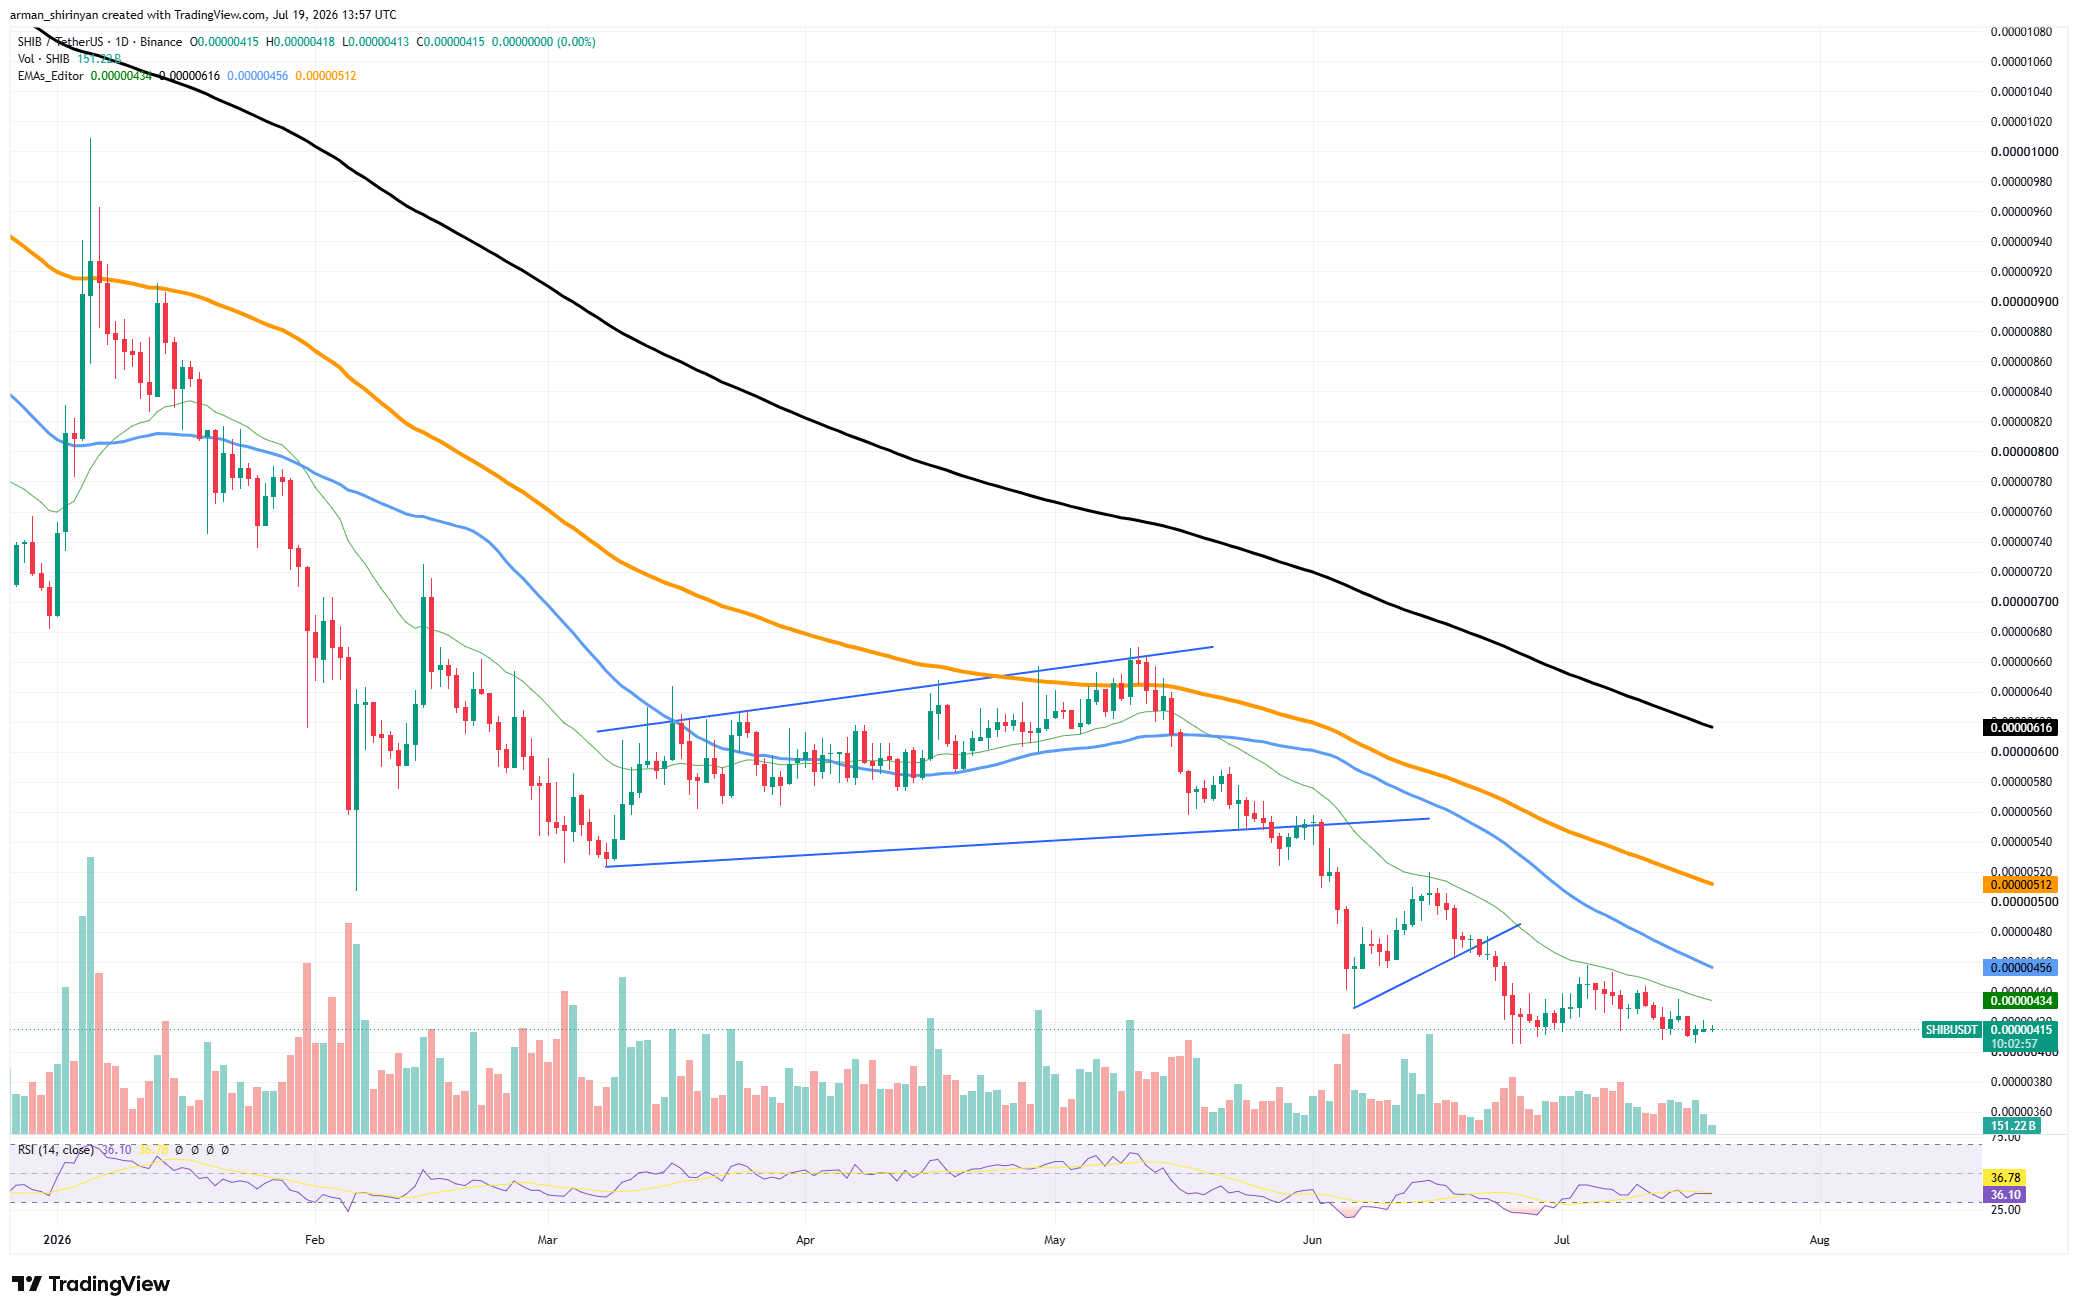
The range of recent trading activity has shrunk to near yearly lows. Although this might seem positive at first glance, the low volume of purchases indicates that market players are still reluctant to make large purchases. SHIB is in the vicinity of oversold territory with an RSI of about 35, but there isn't yet a clear reversal signal.
Regaining the 50-day EMA and creating support above $0.0000045 are the first challenges facing bulls. Any bounce without that action is probably going to remain corrective. SHIB may return to the psychological $0.000004 area and possibly test lower support levels set earlier in the year if selling pressure persists.
Solana's position improvement
Despite its recent decline, Solana offers a notably better technical picture than many major altcoins. Before going into a sound consolidation phase, SOL surged above $80 after making a significant comeback from June lows around $60. Solana is still above both its 50-day and 100-day moving averages, currently trading at about $76.
A small descending wedge pattern, which frequently acts as a continuation structure during larger recoveries, has been formed by the recent decline. Crucially, sellers have failed to drive the asset below crucial support in the $73–$74 range. Instead of panic selling, the RSI stays near 50, suggesting balanced market conditions. In the event that overall market sentiment improves, this neutrality allows for another bullish attempt.
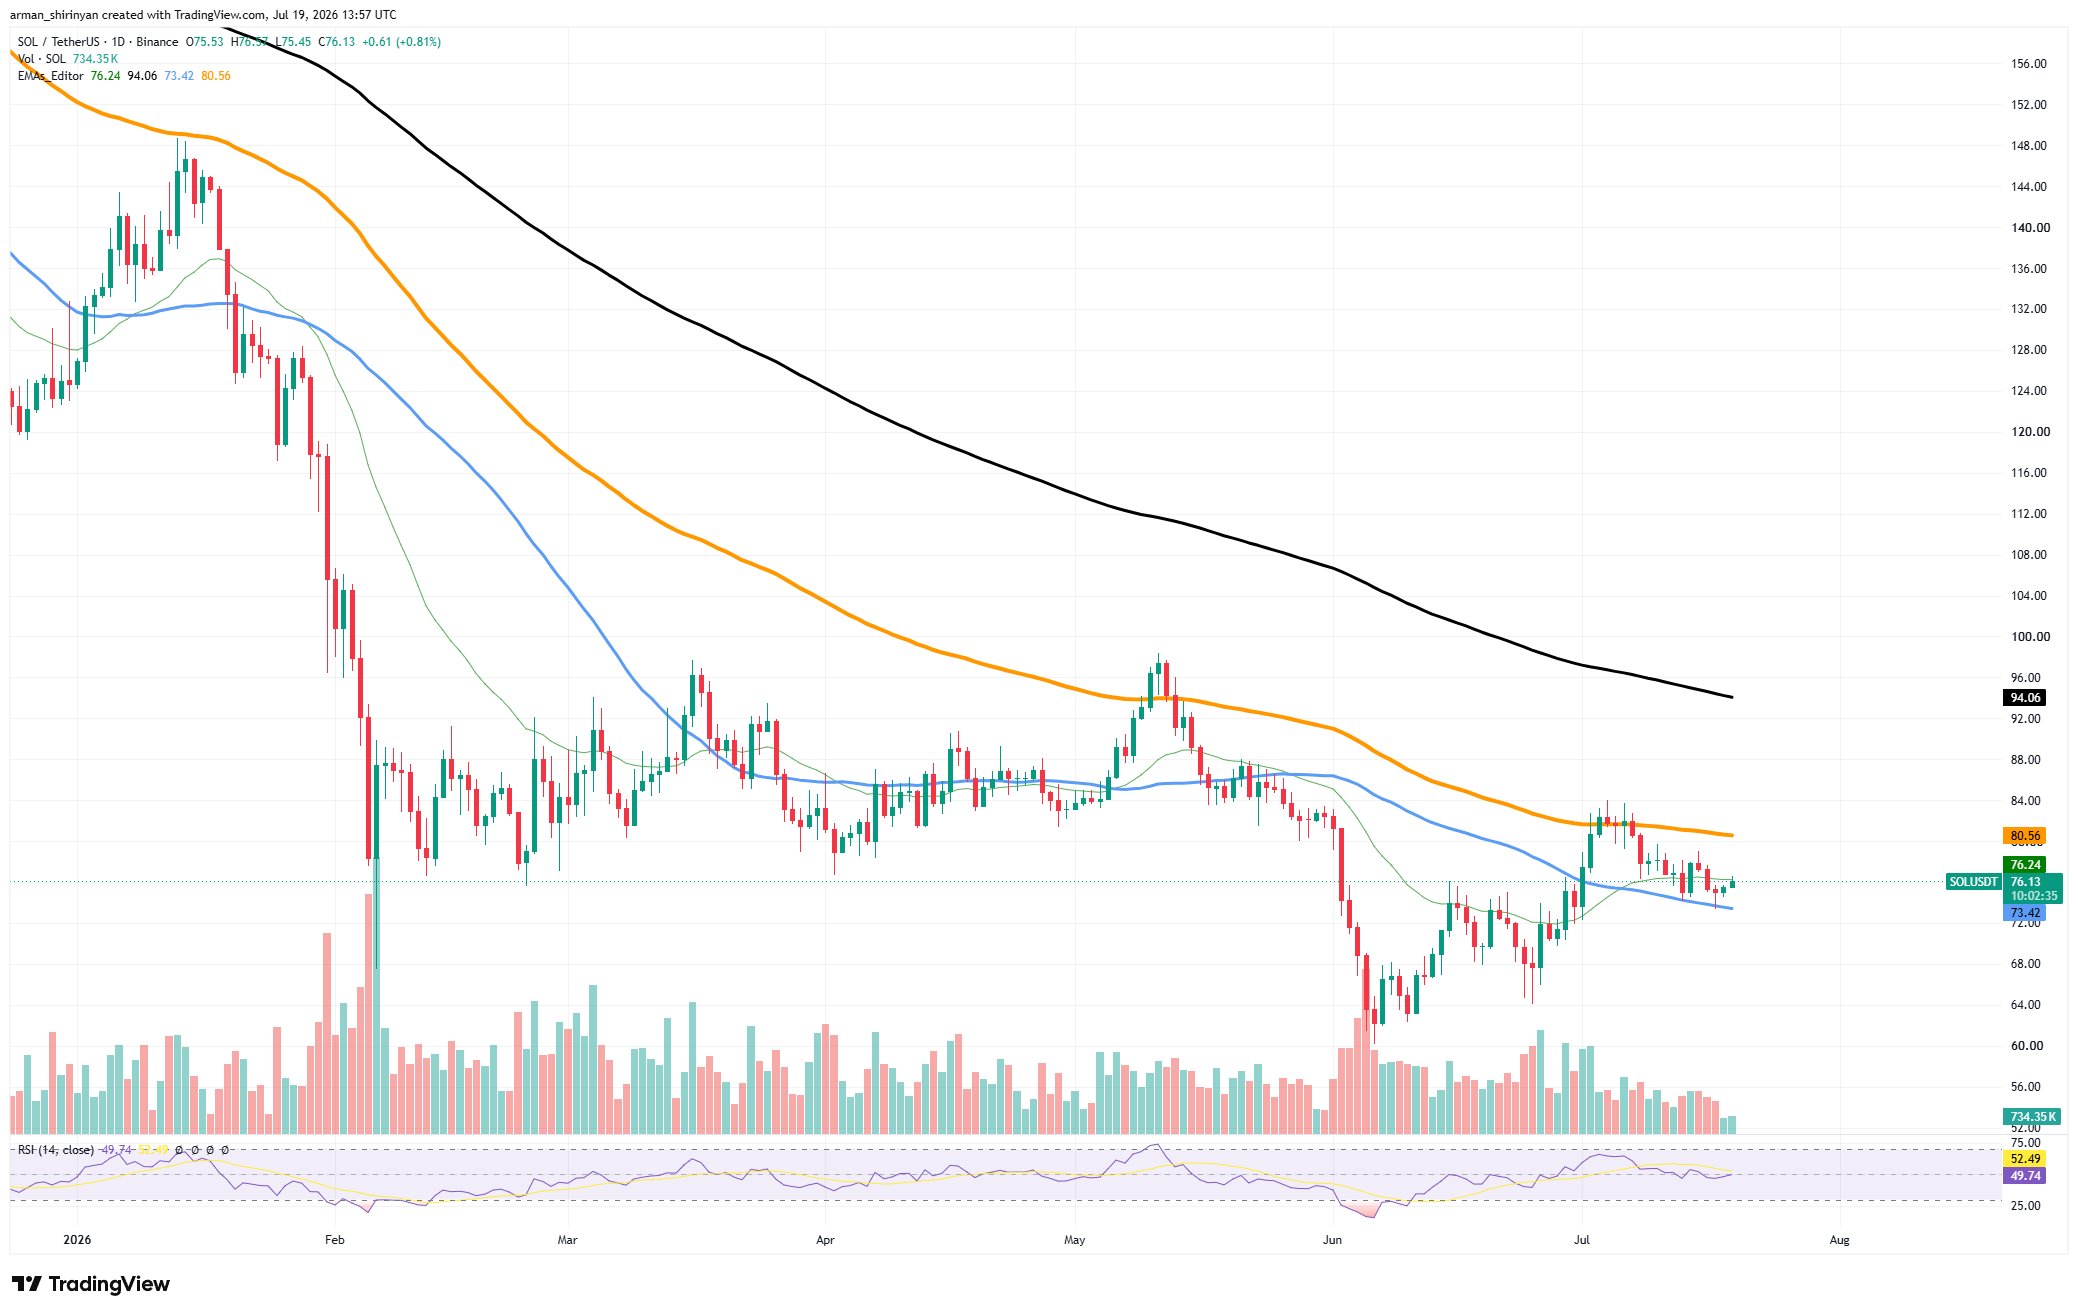
The 200-day moving average is currently located between $80 and $81, which continues to be the crucial resistance zone. Solana's prospects would be greatly enhanced by a successful breakout above that level, which might pave the way for a move into the $90–$95 range.
On the downside, the recovery narrative would be weakened and the likelihood of another move toward the low-$70 area would rise if support around $73 were lost. Despite continuous market volatility, Solana is still one of the few significant altcoins with a comparatively positive medium-term structure.
Hyperliquid's strength remains
Despite the recent decline from local highs near $75, Hyperliquid is still one of the market's strongest large-cap assets. Following a remarkable multi-month surge that propelled HYPE from below $30 to over $75, the asset is now in a consolidation phase as opposed to a full trend reversal. HYPE recently lost its 50-day and 100-day moving averages, which are now concentrated around the $64–$65 range, and is currently trading at about $61.
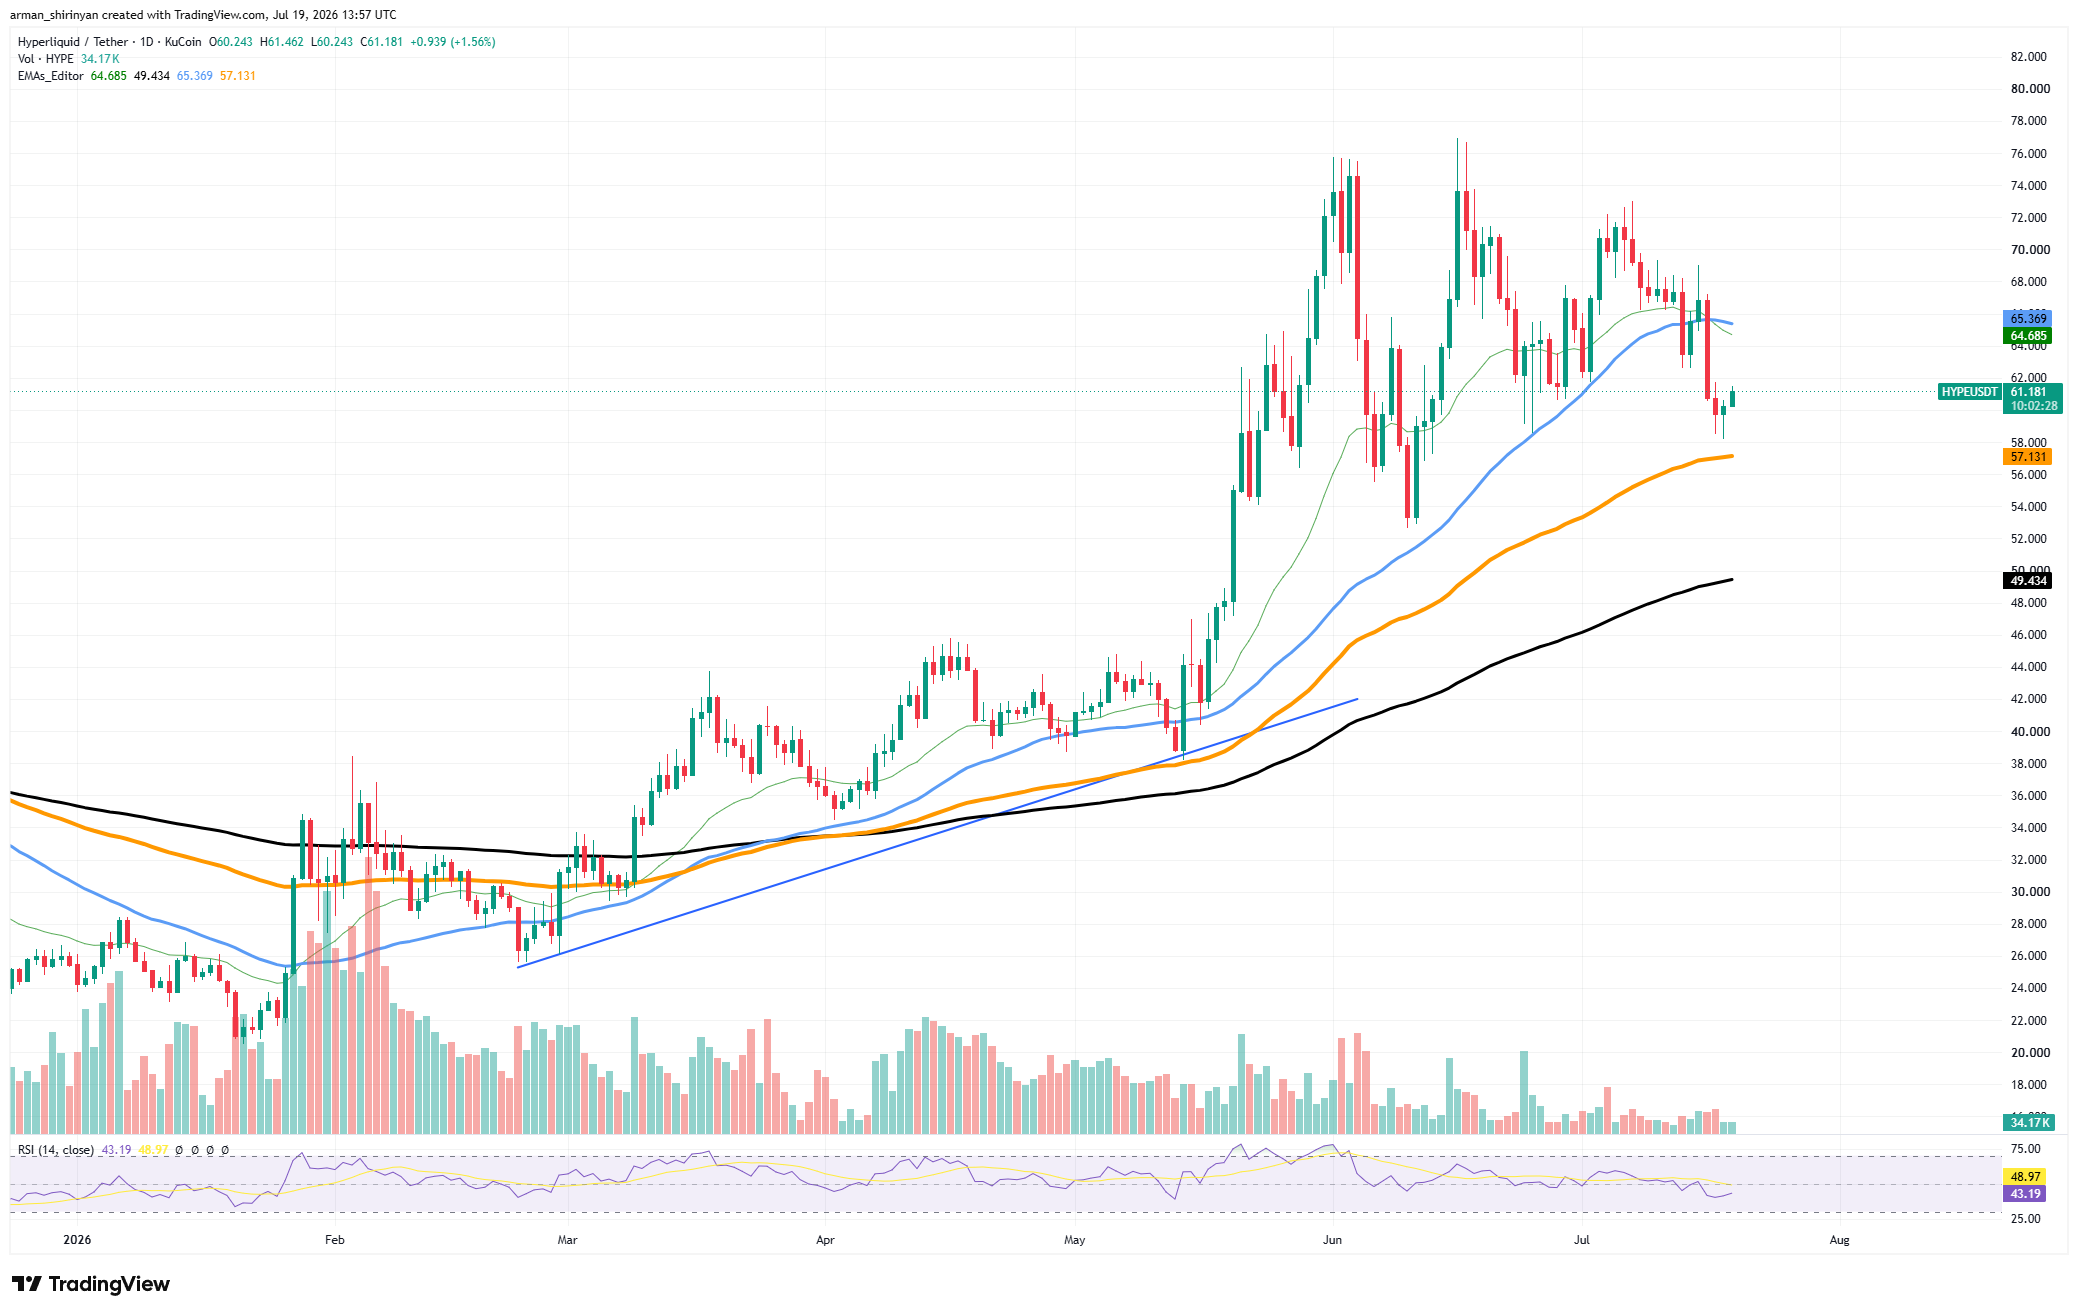
Bulls must reclaim this crucial resistance area in order to resume their upward momentum. But since the price is still comfortably above the rising 200-day EMA at $57 and the 200-day moving average at $49, the overall trend is still positive. Buyers were drawn to the recent decline toward the $58 area almost immediately, resulting in a notable bounce and averting a deeper breakdown.
This response implies that market players continue to see pullbacks as opportunities for purchases rather than as justifications for closing positions. During the correction, volume has decreased, which is generally better than witnessing increased selling volume. Much of the overheated conditions that accompanied the rally earlier in the summer have been eliminated as the RSI has cooled toward 42.
Regaining the $65 mark would probably lead bulls to try again for $70 and possibly the yearly highs. Support between $57 and $58 becomes the most crucial area to watch if sellers take back control. A move toward the 200-day trend line would be possible if that area were lost, which would probably hasten profit-taking.
XRP remains stuck
As the asset continues to trade around $1.09, XRP is still stuck in a tightening technical structure. A distinct descending resistance line on the chart is compressing price action against rising support, resulting in a triangle formation that is getting closer to its resolution point.
The overall trend is still in favor of bears, even though the setup points to a bigger move. The 50-day, 100-day, and 200-day moving averages, which are all stacked above $1.10 to $1.24, are still above XRP. Any attempt at a breakout will have to overcome this dense resistance cluster.
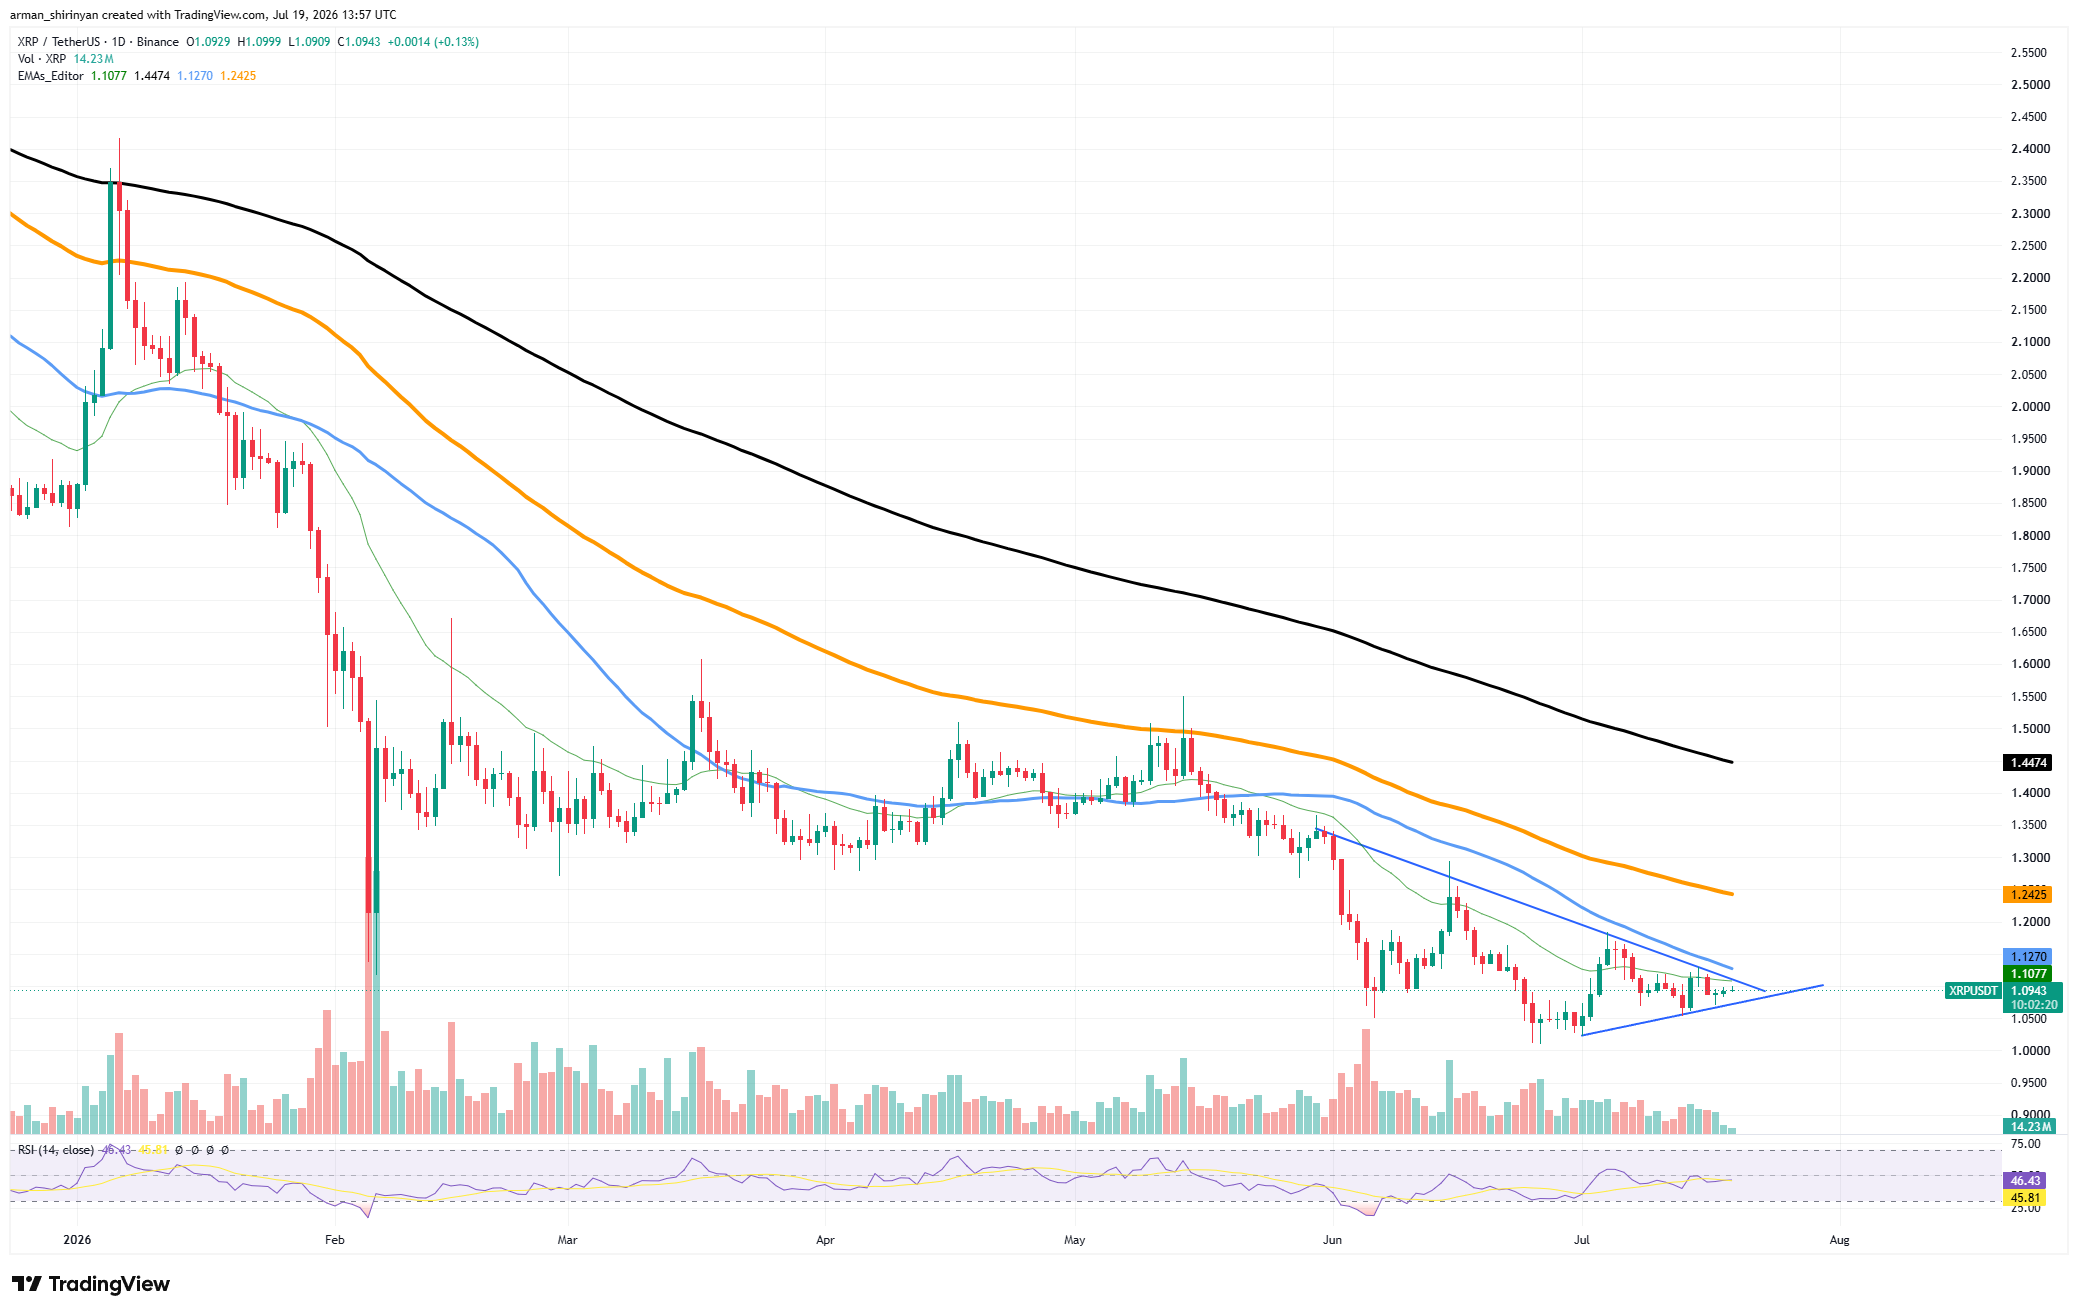
The psychological $1.00 level of support has held several times in July, which is good news for bulls. Sellers kept pushing XRP lower, but they were unable to create a long-term breakdown below that level. The market's indecision is reflected in an RSI close to 46. The chart's narrowing triangle indicates that neither buyers nor sellers currently have a clear advantage.
The immediate bearish structure would be invalidated by a breakout above $1.12, which might also lead to a move toward the larger resistance zone around $1.24 and the 100-day EMA near $1.13. On the other hand, losing the rising support line would probably put XRP through another test of the $1.00 area, and a break below that level would seriously hurt the asset's chances of recovery.
 Dan Burgin
 U.Today Editorial Team
