

Disclaimer: The opinions expressed by our writers are their own and do not represent the views of U.Today. The financial and market information provided on U.Today is intended for informational purposes only. U.Today is not liable for any financial losses incurred while trading cryptocurrencies. Conduct your own research by contacting financial experts before making any investment decisions. We believe that all content is accurate as of the date of publication, but certain offers mentioned may no longer be available.

XRP: XRP remains in post-breakout consolidation above $1.33–$1.35, with a break above $1.45 needed to reopen the path toward $1.50–$1.55.
Zcash (ZEC): ZEC retains strong bullish momentum above $1,050 despite extreme volatility, while a breakout above $1,200–$1,280 could trigger another price-discovery move.
Bitcoin (BTC): Bitcoin remains structurally bullish while holding $76,000–$77,000, but buyers need to clear the $80,000–$82,000 resistance zone to resume the broader rally.
Ethereum (ETH): Ethereum continues to consolidate bullishly around $2,500, with a confirmed breakout above $2,560 potentially opening the way toward $2,650–$2,700.
Short-term dynamic changes
Following a dramatic August breakout that drastically altered its short-term market structure, XRP is trying to stabilize around $1.40. The token is still having trouble establishing a distinct continuation pattern, but it is currently trading close to $1.398, well above a number of significant moving averages.
This zone has drawn buyers on several occasions in September and closely aligns with the long-term moving average that can be seen on the daily chart. In recent sessions, XRP briefly fell below the area but swiftly recovered, indicating that sellers have not yet taken control.
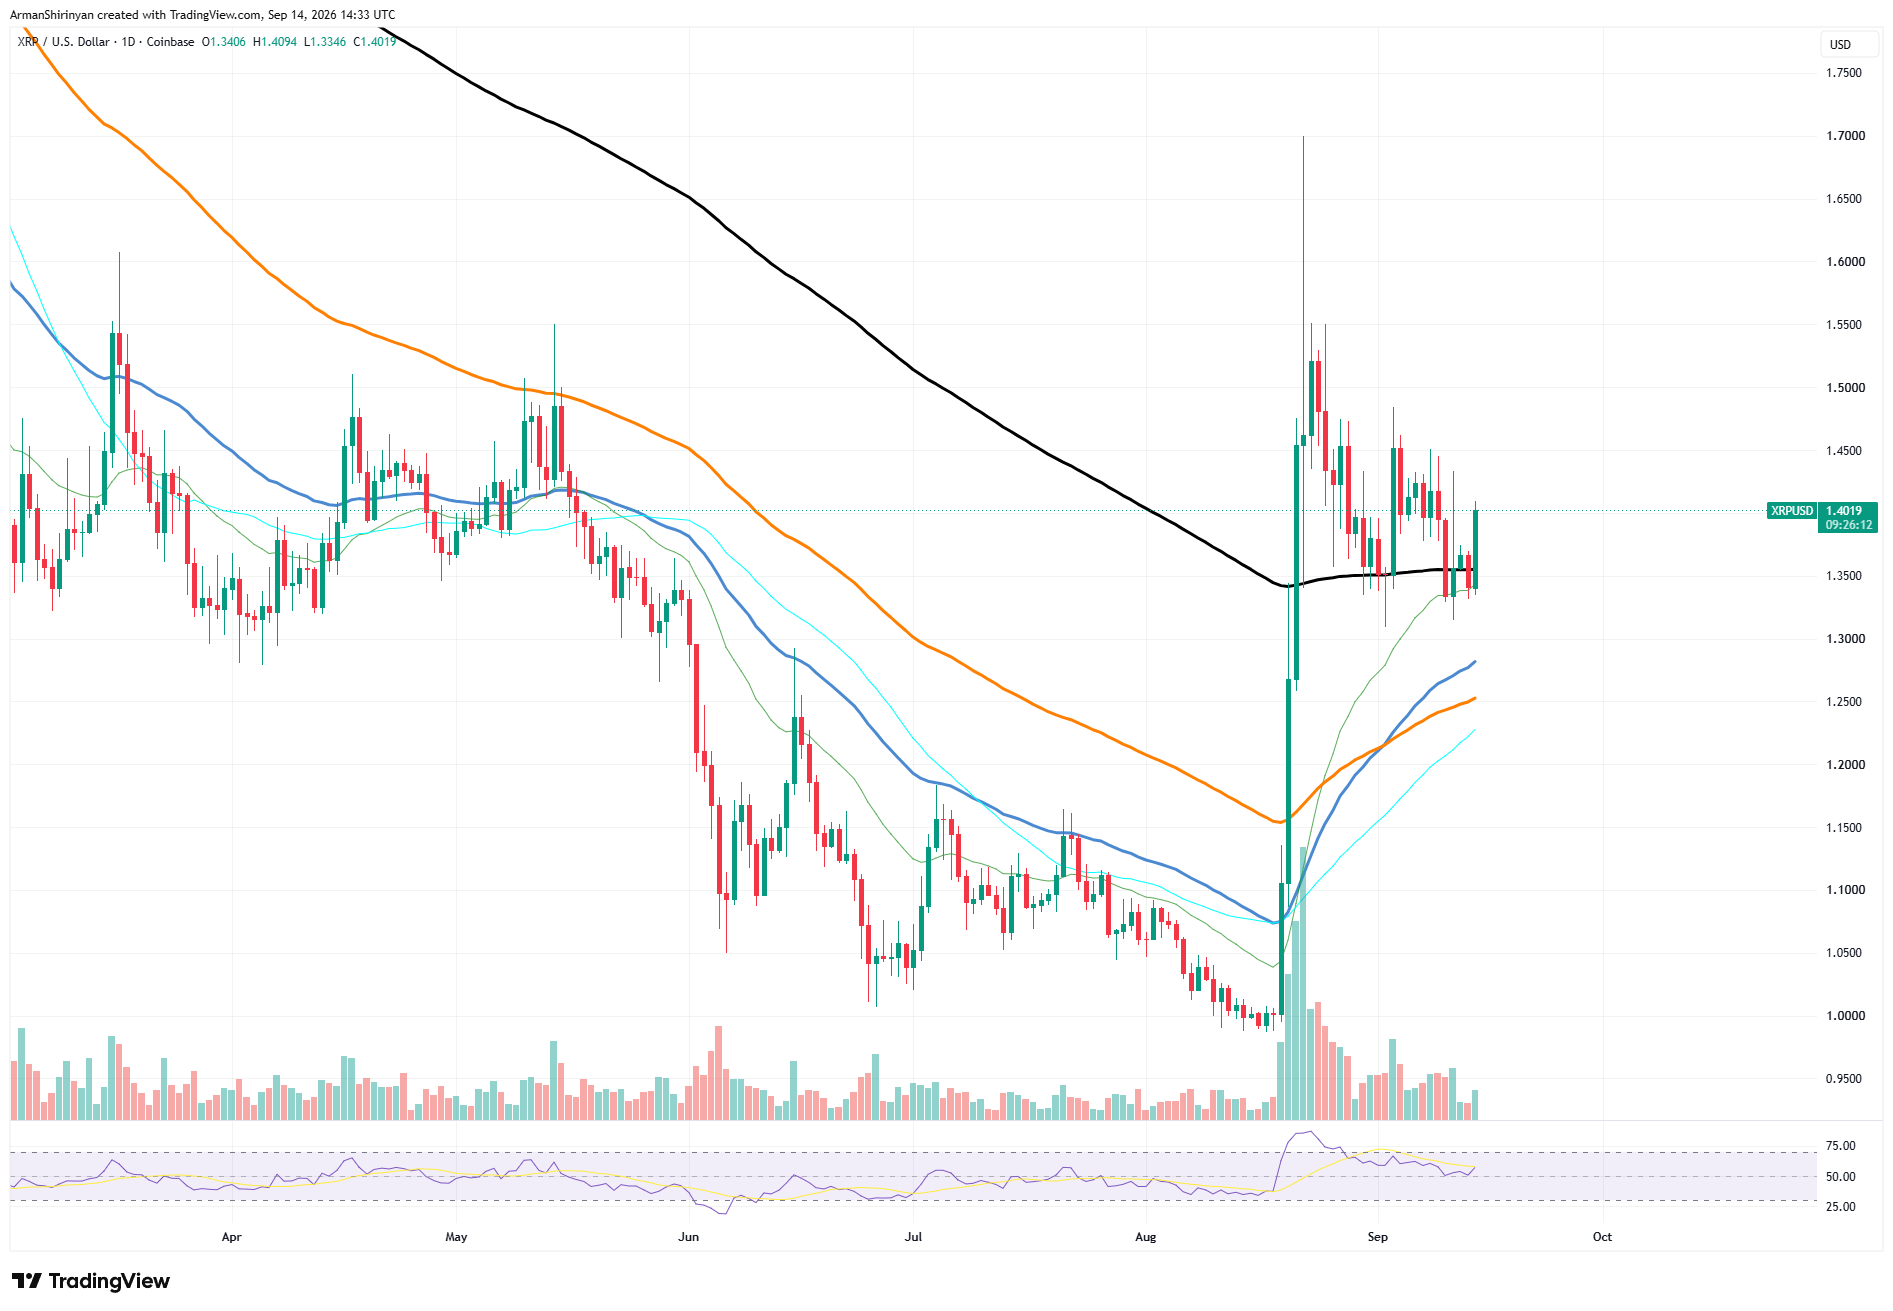
The first significant resistance is between $1.42 and $1.45 above the current price. Multiple September rallies have stalled there. The structure would be significantly improved by a decisive daily close above $1.45, which could lead to another attempt at $1.50–$1.55.
Beyond that, the August wick at $1.70 continues to be the main local extreme, though XRP would require much greater momentum to overcome it. Momentum currently appears fairly balanced. After the August rally, the daily RSI fell precipitously from overbought territory and is currently at about 56.

Because XRP has maintained the majority of its breakout gains while eliminating the extreme momentum readings, that cooling process is beneficial. The downside structure is straightforward. The current consolidation would be weakened if $1.33 were lost, and focus would shift to about $1.28, where a rising moving average offers additional possible support.
If that support also fails, the $1.20–$1.25 region would become significant. Rather than confirming a new leg higher, XRP is currently in post-breakout consolidation. Bulls are in a good position if price holds between $1.33 and $1.35, but $1.45 must be cleared before another significant expansion is likely.
Zcash's momentum is there
After its massive rise from below $500 in August to a peak of about $1,280 in September, Zcash continues to be one of the market's most extreme momentum trades. ZEC is currently trading close to $1,147, indicating that despite significant volatility around the highs, the token has maintained a sizable portion of the move.
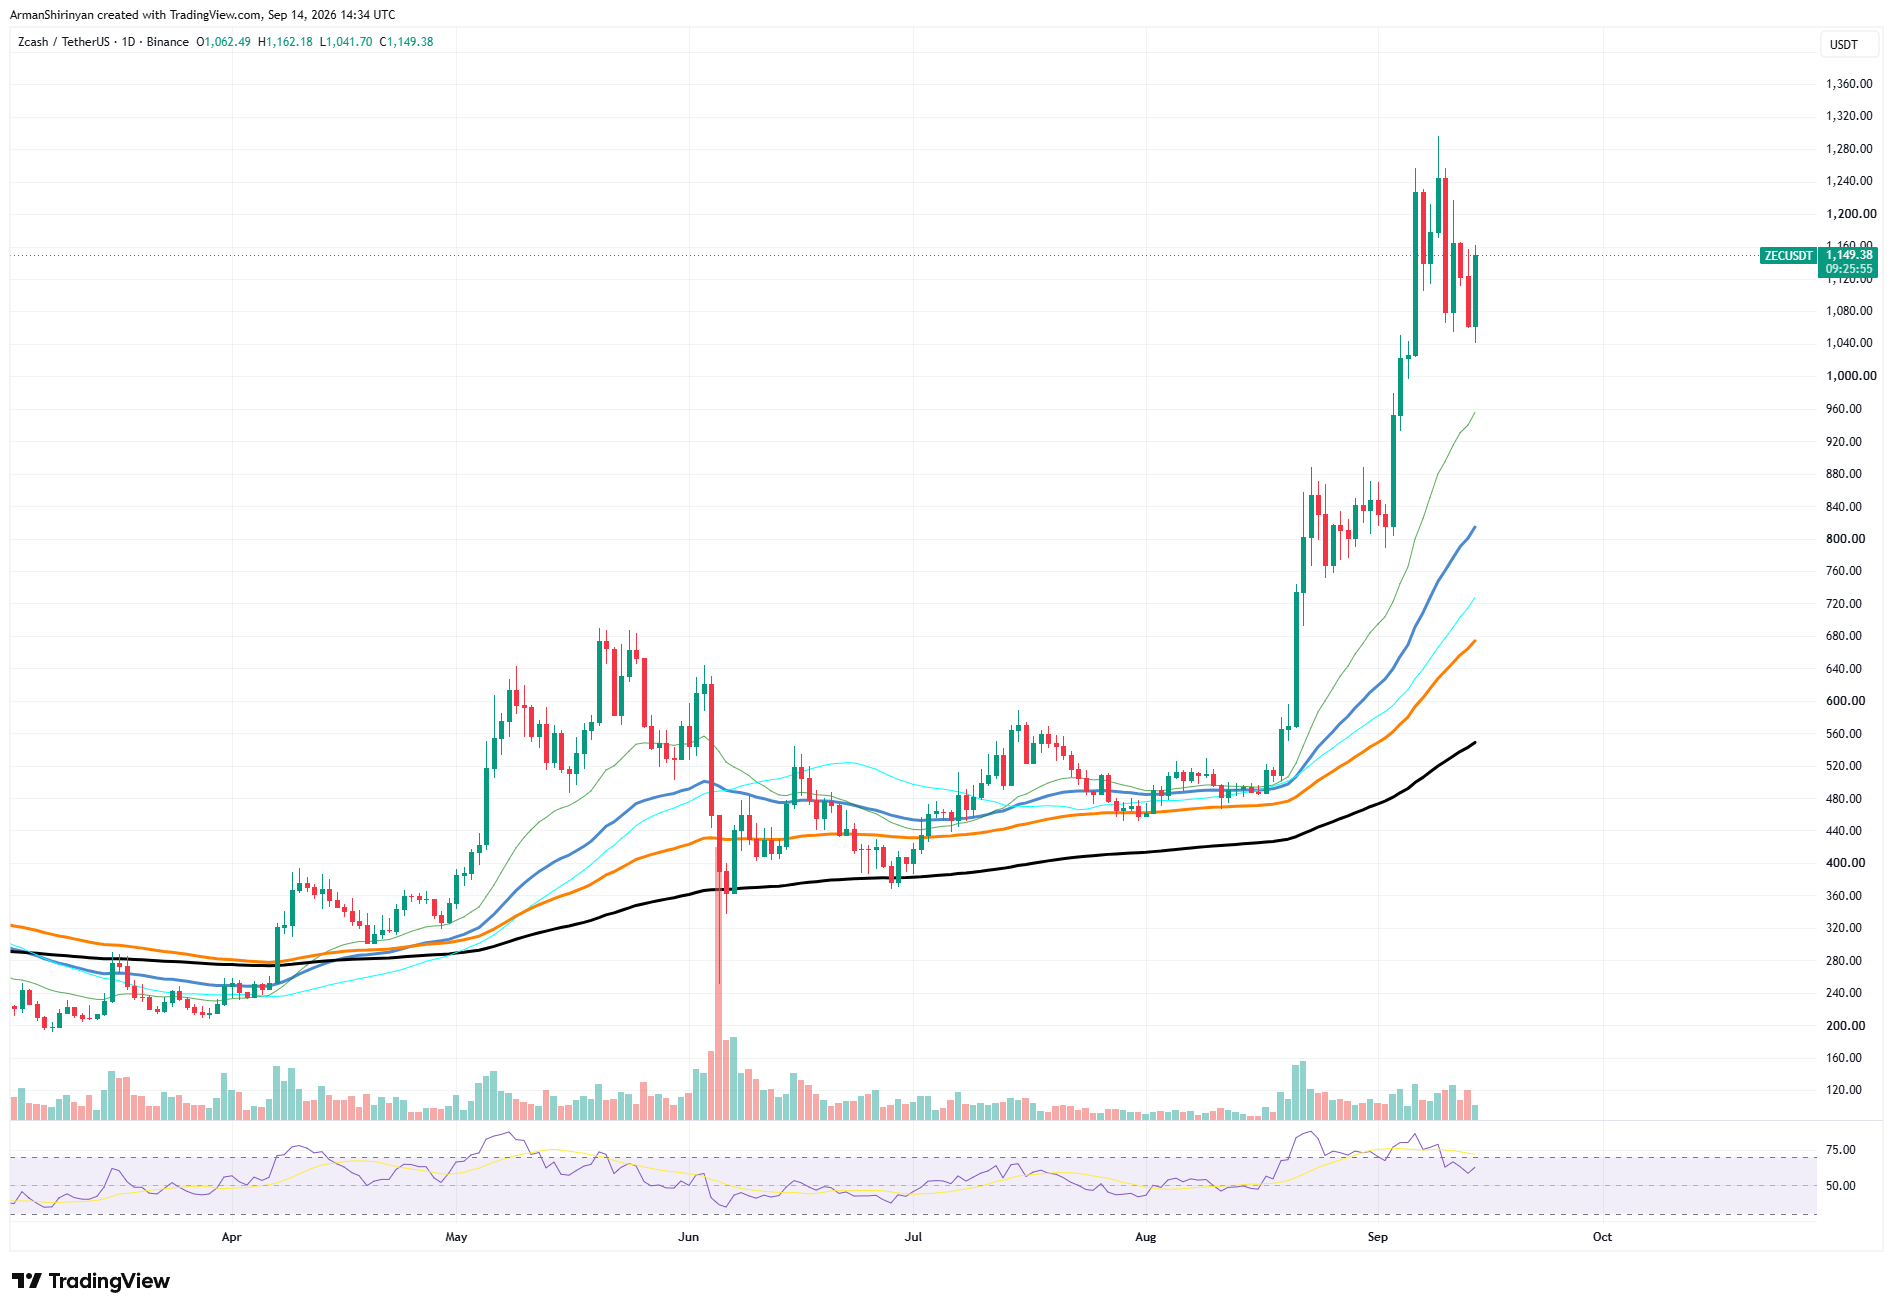
The daily structure remains very bullish. ZEC trades significantly above all major moving averages, with the shortest average rising to about $950. Longer averages remain significantly lower at $800, $680, and $550, demonstrating how quickly prices have moved away from their prior equilibrium.
That distance, however, also poses a significant correction risk. ZEC has already experienced heavy selling between $1,200 and $1,280. Long intraday ranges and a number of large daily candles show fierce competition between buyers and profit-taking sellers.

The price range of $1,160 to $1,200 is the immediate resistance. The recent $1,250–$1,280 high would come back into focus if $1,200 were recovered. Another price-discovery phase could be established by a clear breakout above $1,280, with $1,300 serving as the first psychological level above the current high.
About $1,050–$1,080 is the first significant support area on the downside. Following its most recent rejection, ZEC has already recovered in this area. A test of the psychological $1,000 level would become more likely if $1,050 were lost, followed by the sharply rising short-term moving average at $950.
Although volatility is very high, ZEC's trend remains bullish. The current action looks like consolidation following a vertical advance above $1,050. A deeper correction toward $1,000–$950 becomes much more likely below that level.
Bitcoin's consolidation
After its strong August comeback, which took it from about $63,000 to over $80,000 in a matter of weeks, Bitcoin is consolidating around $78,250. Although the initial momentum has subsided, bulls still have a significant advantage on the daily chart: Bitcoin is still trading comfortably above its major moving averages.
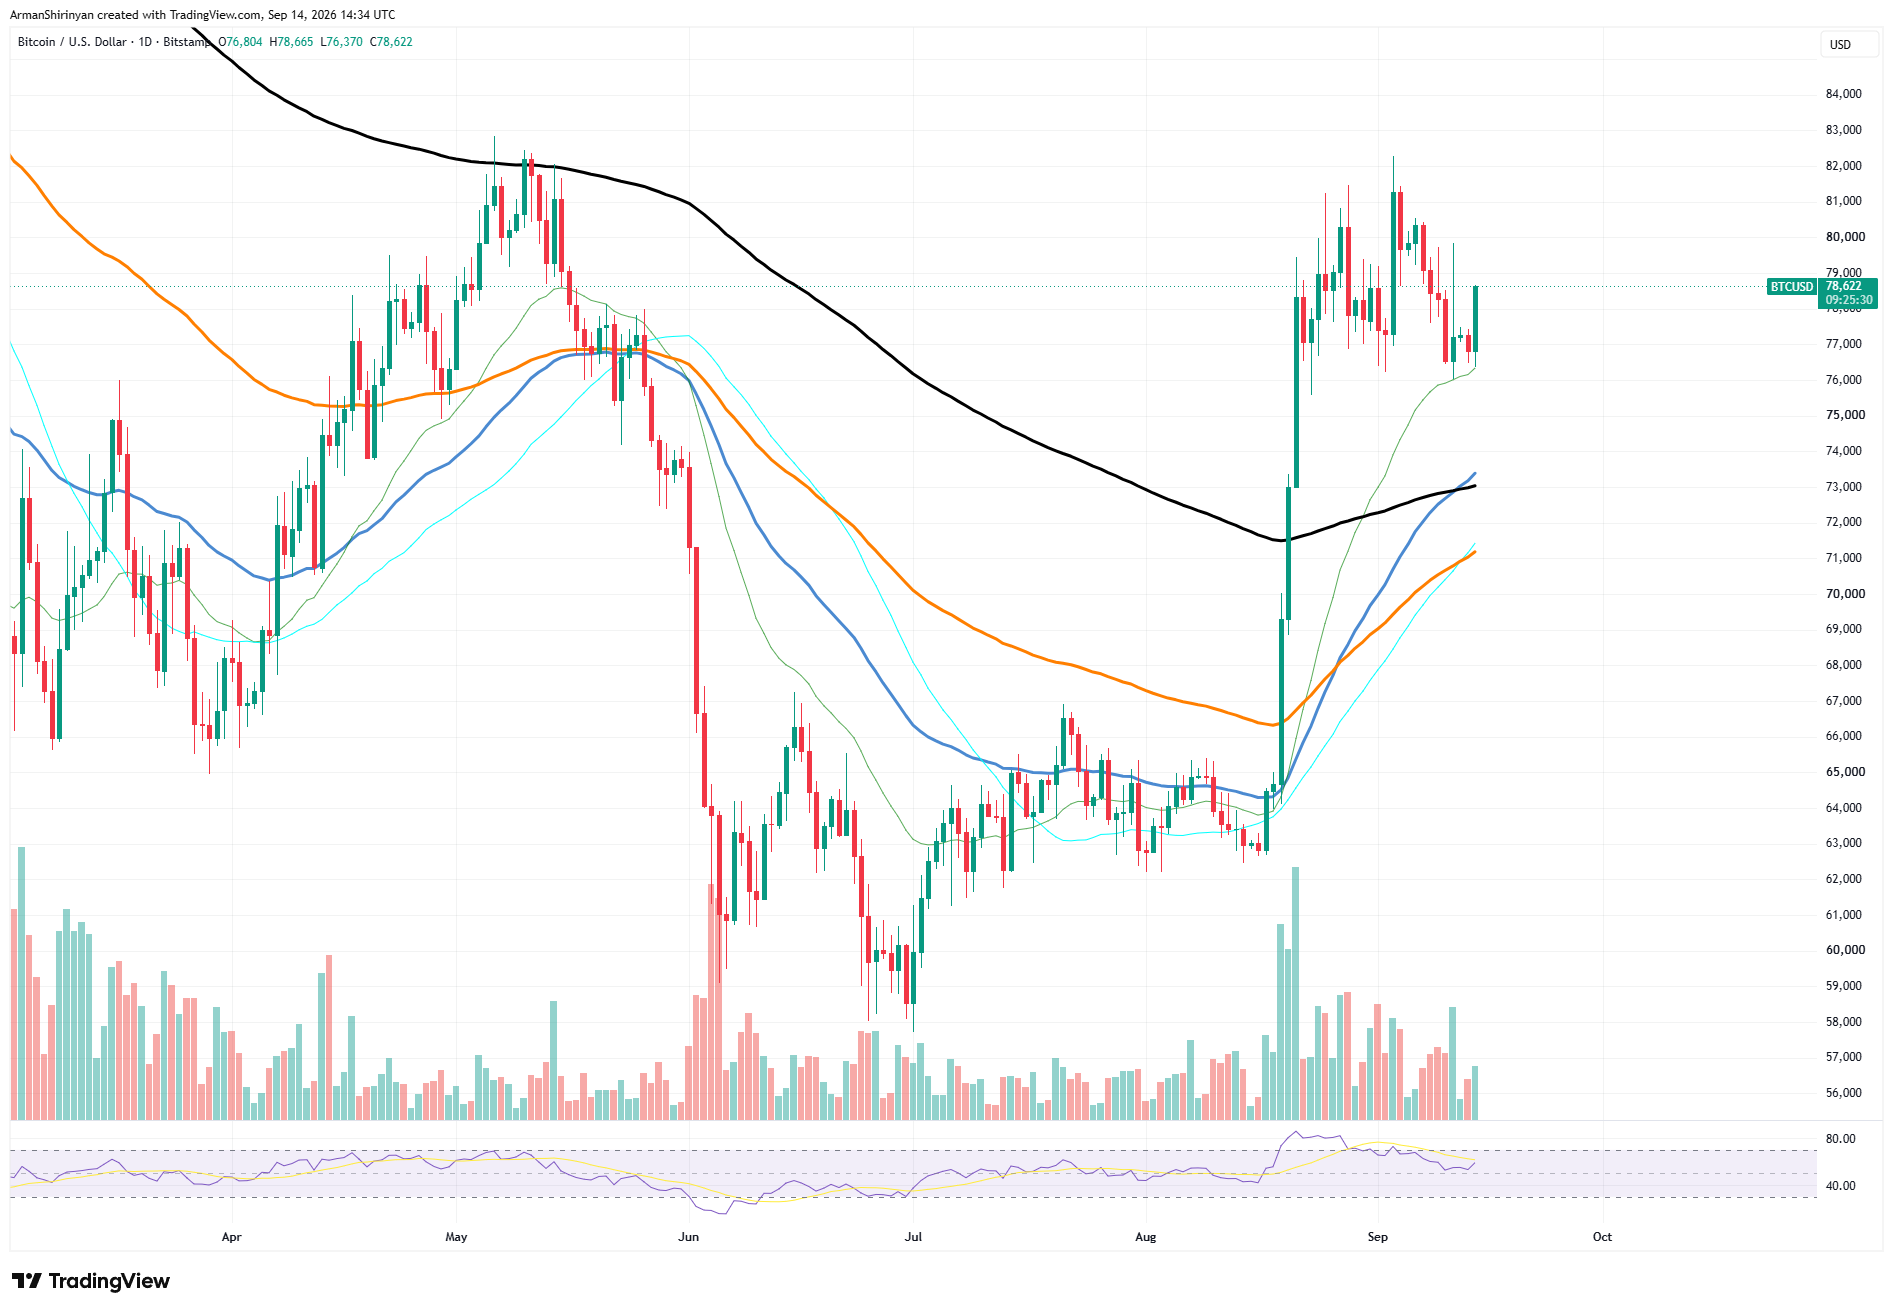
The immediate structure revolves around the $76,000–$77,000 support area. Since the beginning of September, Bitcoin has tested this area multiple times, but buyers have consistently prevented a more serious decline.
The short-term moving average is also approaching this zone, providing additional technical support. The first significant barrier on the upside remains $79,000–$80,000. Although Bitcoin has frequently traded above $80,000, it has not been able to sustain acceptance at that level. The next significant barrier is the recent peak between $81,500 and $82,000.

The current consolidation would be resolved and the broader recovery could resume if the daily close were above that level. Momentum has significantly stabilized. After entering overbought territory during the August breakout, the RSI has moved back toward the mid-50s. As a result, BTC no longer exhibits the same overheated momentum conditions, but it also shows less buying pressure than during the initial rally.
There has been a major improvement in the broader technical structure. Bitcoin is currently trading above the long-term moving average at $73,000, while the medium-term averages are rising below the price.
Ethereum jumps to $2,500
After one of its biggest recent upside expansions, Ethereum is still trading close to $2,500. ETH jumped from about $1,880 in August to over $2,500, and in contrast to many strong rallies, the asset has given back comparatively little of the gain.
Right now, ETH is trading at about $2,503, with price action forming a tight consolidation between about $2,400 and $2,550. This range has been the main technical structure on the daily chart for a number of weeks. The bullish argument stems from where this consolidation is taking place.
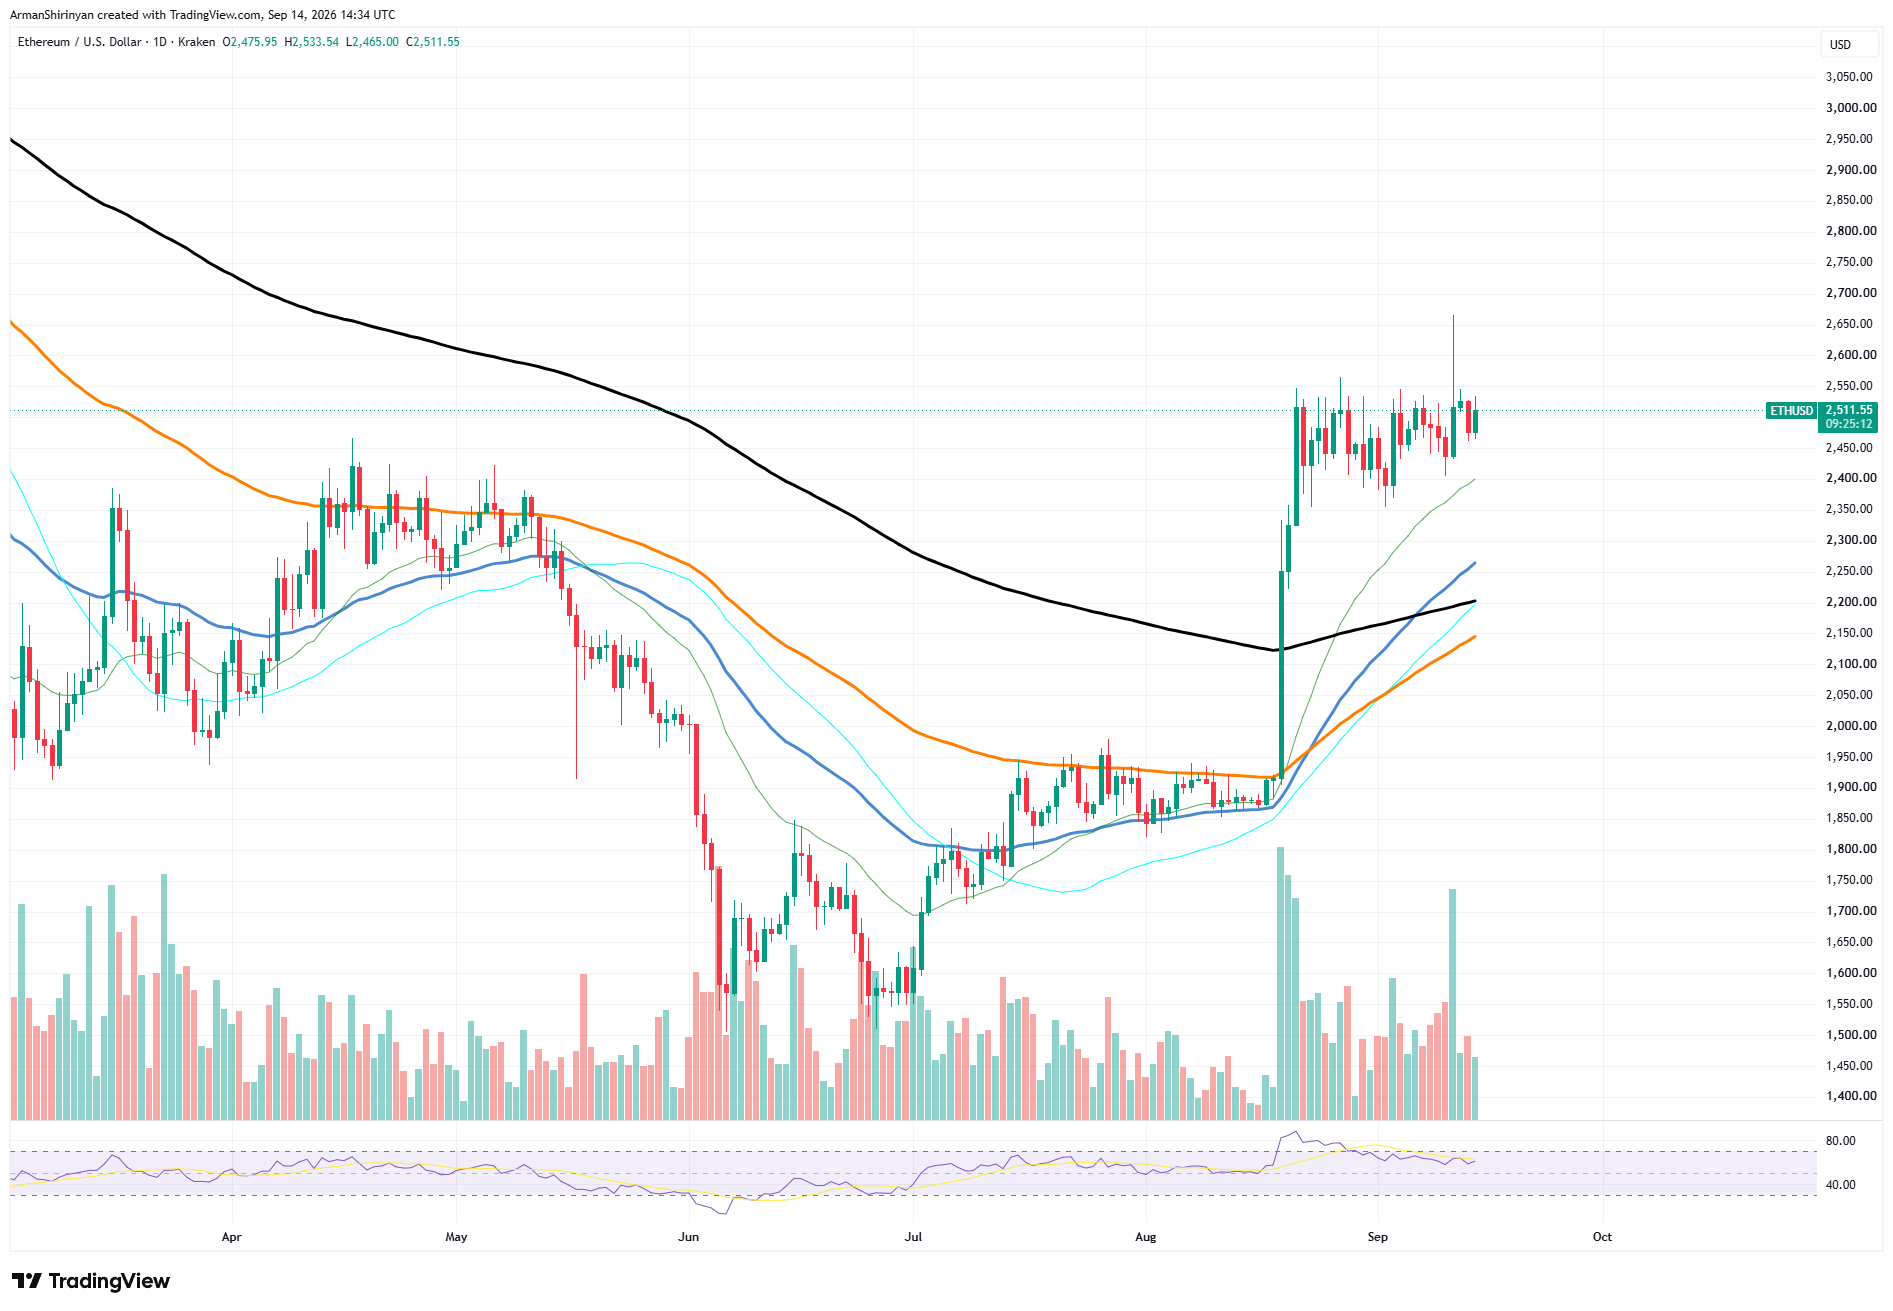
Ethereum remains well above all of the main moving averages. While the medium-term averages are between $2,200 and $2,260, the shortest average has risen to $2,400. Following the August breakout, ETH has held onto its high price range rather than immediately retreating toward those averages.
Resistance remains concentrated between $2,520 and $2,560. Ethereum has tested this area several times without a convincing daily breakout. If $2,560 is eventually cleared, one notable wick reaches about $2,660, making that level the next important target. Momentum has decreased without turning bearish.

The RSI entered overbought territory before settling in the mid-50s. This normalization will allow ETH to extend further if buyers return. The primary support is now $2,400–$2,440. The consolidation would be weakened if that area were lost, exposing the $2,300 level, followed by the rising moving-average cluster between $2,200 and $2,250.
For the time being, Ethereum's structure favors continuation over reversal. The market has absorbed the August rally without a significant decline. A confirmed break above $2,560 would significantly strengthen that setup and bring the $2,650–$2,700 area into focus.
 Dan Burgin
 U.Today Editorial Team
