

Disclaimer: The opinions expressed by our writers are their own and do not represent the views of U.Today. The financial and market information provided on U.Today is intended for informational purposes only. U.Today is not liable for any financial losses incurred while trading cryptocurrencies. Conduct your own research by contacting financial experts before making any investment decisions. We believe that all content is accurate as of the date of publication, but certain offers mentioned may no longer be available.

Despite experiencing a strong post-rally correction, Near is getting close to a potentially significant technical milestone. Few traders anticipated a potential golden cross formation just weeks ago, but the chart now shows the 50-day moving average quickly rising toward the 200-day moving average.
After months of compression, NEAR surged higher in May, sparking a huge breakout rally that momentarily moved the price closer to the $3 range. That action fundamentally changed the chart's medium-term structure. In contrast to earlier NEAR selloffs, the overall technical damage is still surprisingly small, even though the rally eventually overheated and sharply retraced.
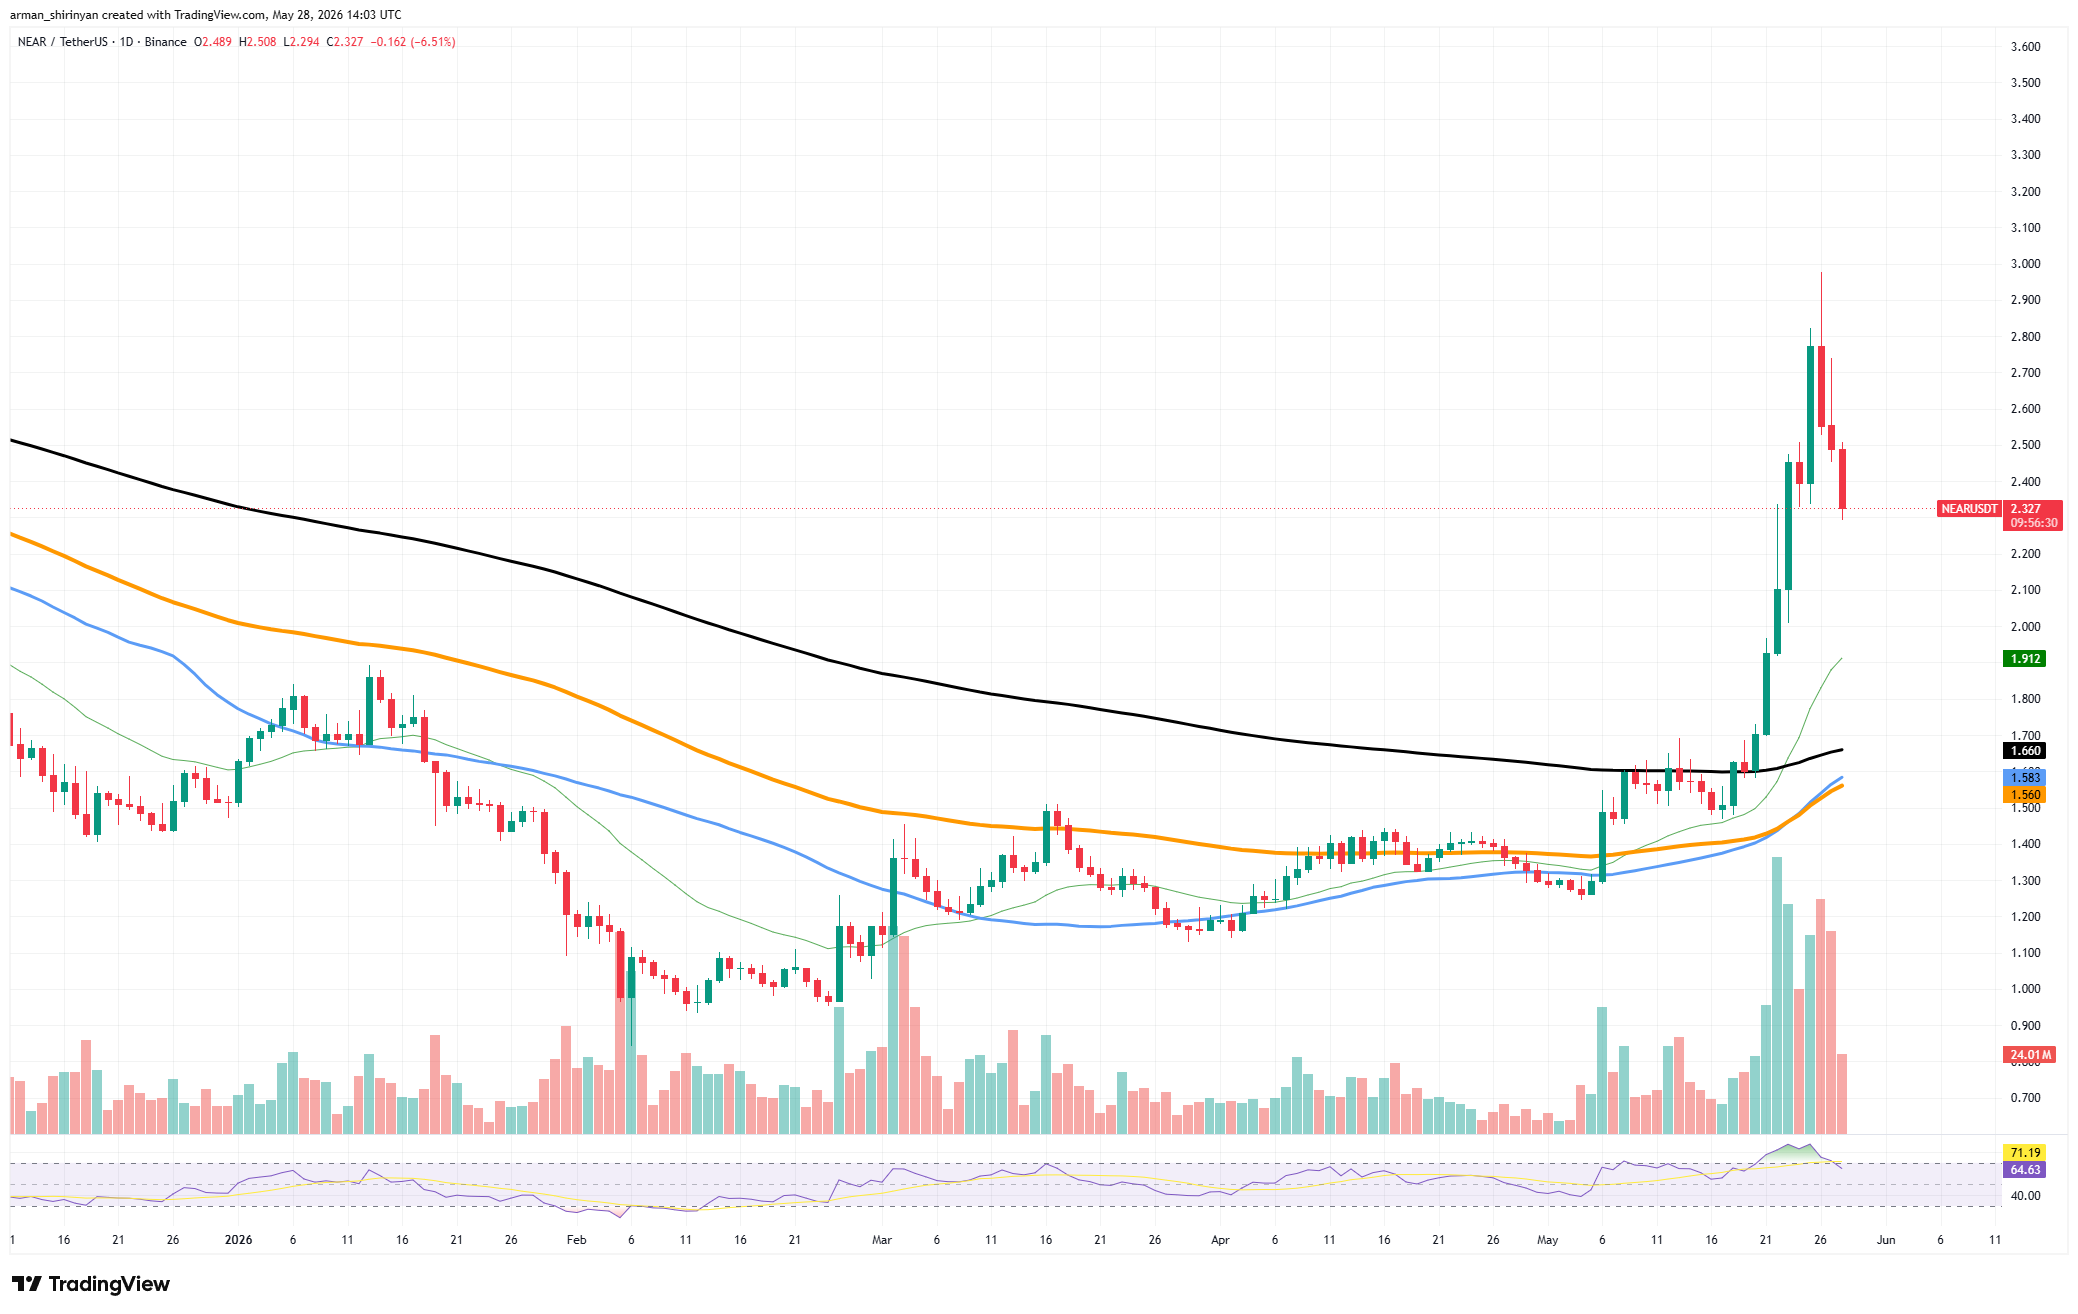
The alignment of the moving averages is crucial. The recent impulse's strength has caused the 50-day MA to rise sharply, while the 200-day MA flattened following months of decline. The distance between them is still rapidly closing. The market may print a full golden cross in the upcoming weeks if NEAR stabilizes close to current levels rather than falling further.
Golden crosses have historically been more significant when they emerge following protracted bearish periods than when they occur during already established uptrends. If momentum picks up again, swing traders may pay more attention to this transition because NEAR spent the majority of the prior cycle trapped under declining long-term resistance.

However, the asset is currently at a crucial decision point. Following the vertical breakout, the price lost momentum and is currently testing support near the 50-day moving average. Because a breakdown would probably push NEAR toward the $1.60-$1.65 zone, where the 100-day trend support is currently located, bulls must actively defend this area.
The volume behavior is still inconsistent. Although there was a lot of participation during the breakout, both buyers' and sellers' conviction has been waning in recent sessions. Instead of an immediate continuation or collapse, that typically indicates consolidation.
The fact that NEAR is still above the rising medium-term trend structure that developed during April and May is another significant factor. NEAR still holds onto a significant amount of its breakout gains in contrast to many altcoins that completely retraced their rallies. That relative strength matters.
The golden cross narrative has the potential to become a significant momentum catalyst if buyers are able to recover the $1.90-$2.00 region with increased volume. However, the market might considerably postpone that bullish confirmation if the price keeps declining below the short-term averages.
Dogecoin loses its strengh
After losing the psychological $0.10 region, Dogecoin has fallen back into risky territory, and the chart structure now appears considerably weaker than it did earlier this month.
The daily setup indicates that DOGE is once again trading below almost all of the major moving averages, with short-term momentum rapidly waning following the unsuccessful May breakout attempt. A traditional lower-high formation developed from the rejection close to the $0.11-$0.12 zone.
During the most recent rally, the price momentarily surpassed the 20-day and 50-day moving averages, but buyers were unable to maintain volume. The 200-day moving average is still well above the $0.12 region, serving as a long-term bearish ceiling, and DOGE is currently directly beneath those trend indicators once more.

The structure below price is what raises more concerns about this move. Since February, DOGE has maintained an ascending support line, giving the impression of slow accumulation. Following several weak daily closes close to support, that trendline now appears vulnerable. The market may swiftly return to the wider liquidity zone around $0.085 if bears force a clean breakdown below the $0.095-$0.097 range.
Moreover, volume does not currently lend credence to a bullish continuation story. Activity briefly increased due to the May impulse, but follow-through purchases virtually vanished right away. Since then, sell pressure has gradually reappeared and candles have tightened, which is typically an indication that speculative momentum traders have already left the market.
Technically speaking, the 20-day EMA, the 50-day EMA, and the declining 100-day moving average are the three immediate resistance layers that DOGE is currently up against. Before a meaningful recovery discussion can start, bulls must reclaim the compressed resistance band created by that cluster.
Over the last two weeks, the meme coin industry as a whole has also significantly cooled off. As Bitcoins dominance stabilized, capital rotation into higher-beta assets diminished, depriving DOGE of the speculative fuel that typically propels aggressive upside moves.
XRP pushed to the edge
After being stuck inside a tightening descending triangle structure for months, XRP is getting close to one of the most significant technical levels on its daily chart. As lower highs continue to compress the market from above, the price is currently directly on horizontal support near $1.28-$1.30. The setup is about to make a choice.
The structure of the chart itself is no longer subtle. Since March, XRP has consistently failed to regain the downward trendline that caps each attempt at a recovery. While sellers continue to intervene earlier during rallies, each bounce has gotten weaker. Instead of a healthy consolidation, that typically indicates a decline in buyer conviction.
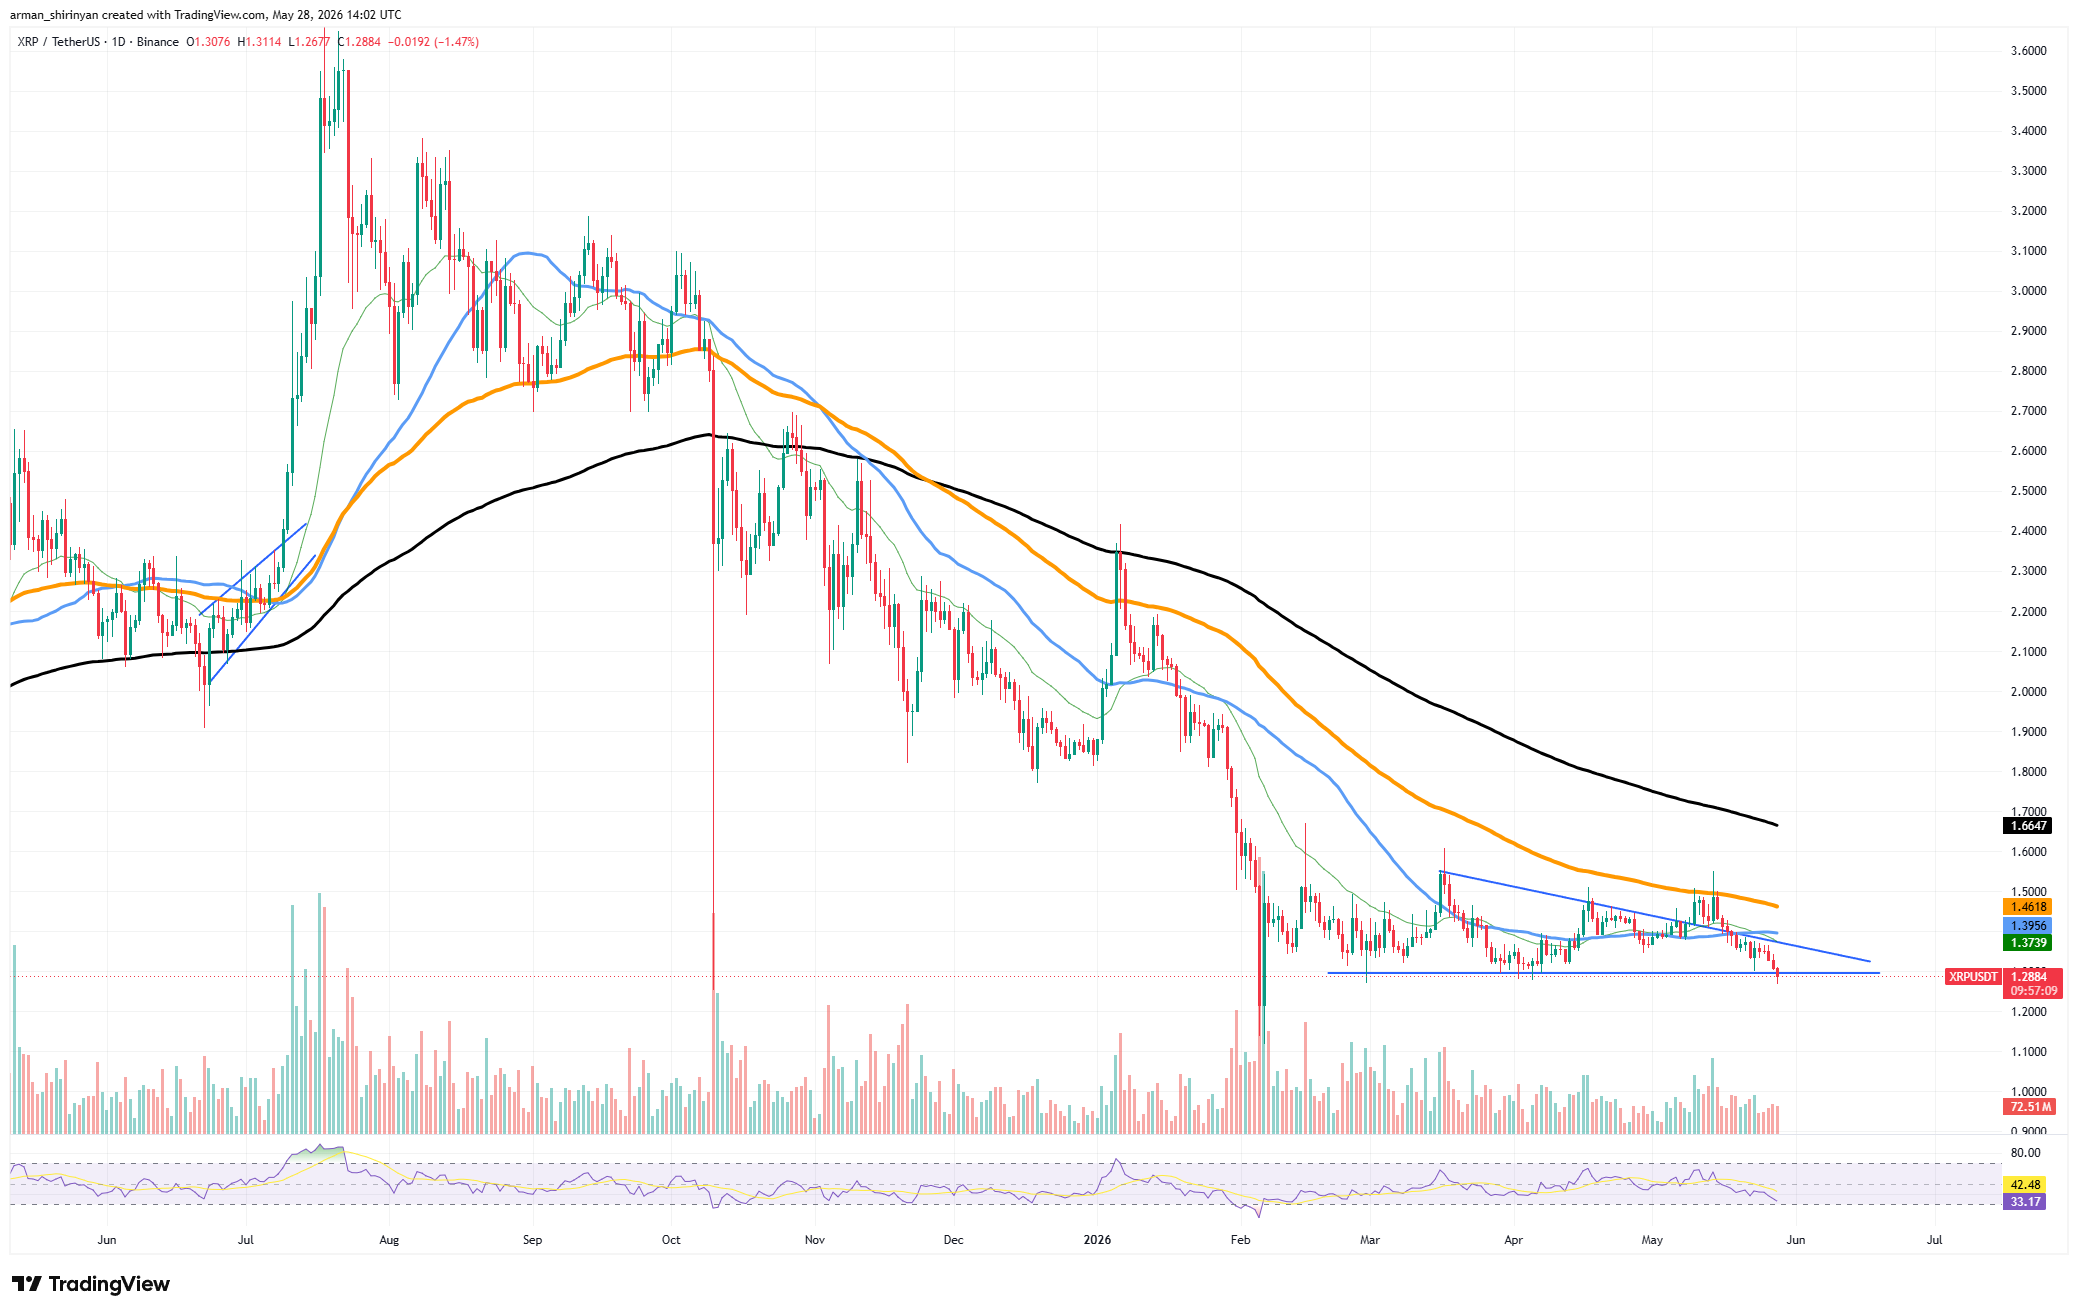
Simultaneously, the horizontal support zone at $1.28 has already undergone numerous tests. Because each bounce uses up resting buy liquidity, repeated support touches are important. Support eventually erodes and breaks if demand does not rise significantly.
The bearish case is further strengthened by volume behavior. During the consolidation phase, which frequently comes before expansion volatility, trading activity has progressively decreased. That volatility expansion statistically favors the continuation of the previous trend in descending triangle formations, and XRP's overall trend since late 2025 has obviously leaned bearish.
The first downward area that traders will probably keep an eye on is located between $1.15 and $1.20 if the breakdown is confirmed with a clear daily close under support. If panic selling picks up speed below that, the market opens the door to psychological support around $1.00, which could turn into a magnet.

Bulls are running out of space, but there is still a bullish invalidation path. In order to push back above the recent lower-high structure around $1.40-$1.45, XRP would need to swiftly regain the declining resistance line. The charts structural weakness persists without that move.
In comparison to previous stages of the cycle, volatility has significantly decreased, which is an important detail. These circumstances frequently come before violent directional expansion. Seldom do markets remain compressed for this long before a resolution is eventually required.
As of right now, support for XRP has not completely collapsed, so it is technically still alive. However, there is very little room for error. The market is essentially on the verge of confirmation, and whether XRP stabilizes for another attempt at recovery or moves into a much deeper corrective phase could be decided by the next few daily candles.
 U.Today Editorial Team
 Dan Burgin
