

Disclaimer: The opinions expressed by our writers are their own and do not represent the views of U.Today. The financial and market information provided on U.Today is intended for informational purposes only. U.Today is not liable for any financial losses incurred while trading cryptocurrencies. Conduct your own research by contacting financial experts before making any investment decisions. We believe that all content is accurate as of the date of publication, but certain offers mentioned may no longer be available.

Ethereum experienced one of the biggest technical changes in months, rising from under $2,000 to roughly $2,496 over the course of multiple trading sessions. As a result, the $3,000 target has come back into play, but before that level becomes the default, ETH still needs to overcome substantial resistance.
Ethereum's Magnitude
The breakout from the extended consolidation between $1,850 and $1,950 is the most significant development. While its major moving averages remained in a bearish configuration, ETH had been stuck below $2,000 for the majority of July and August. That structure was suddenly altered by the most recent impulse.
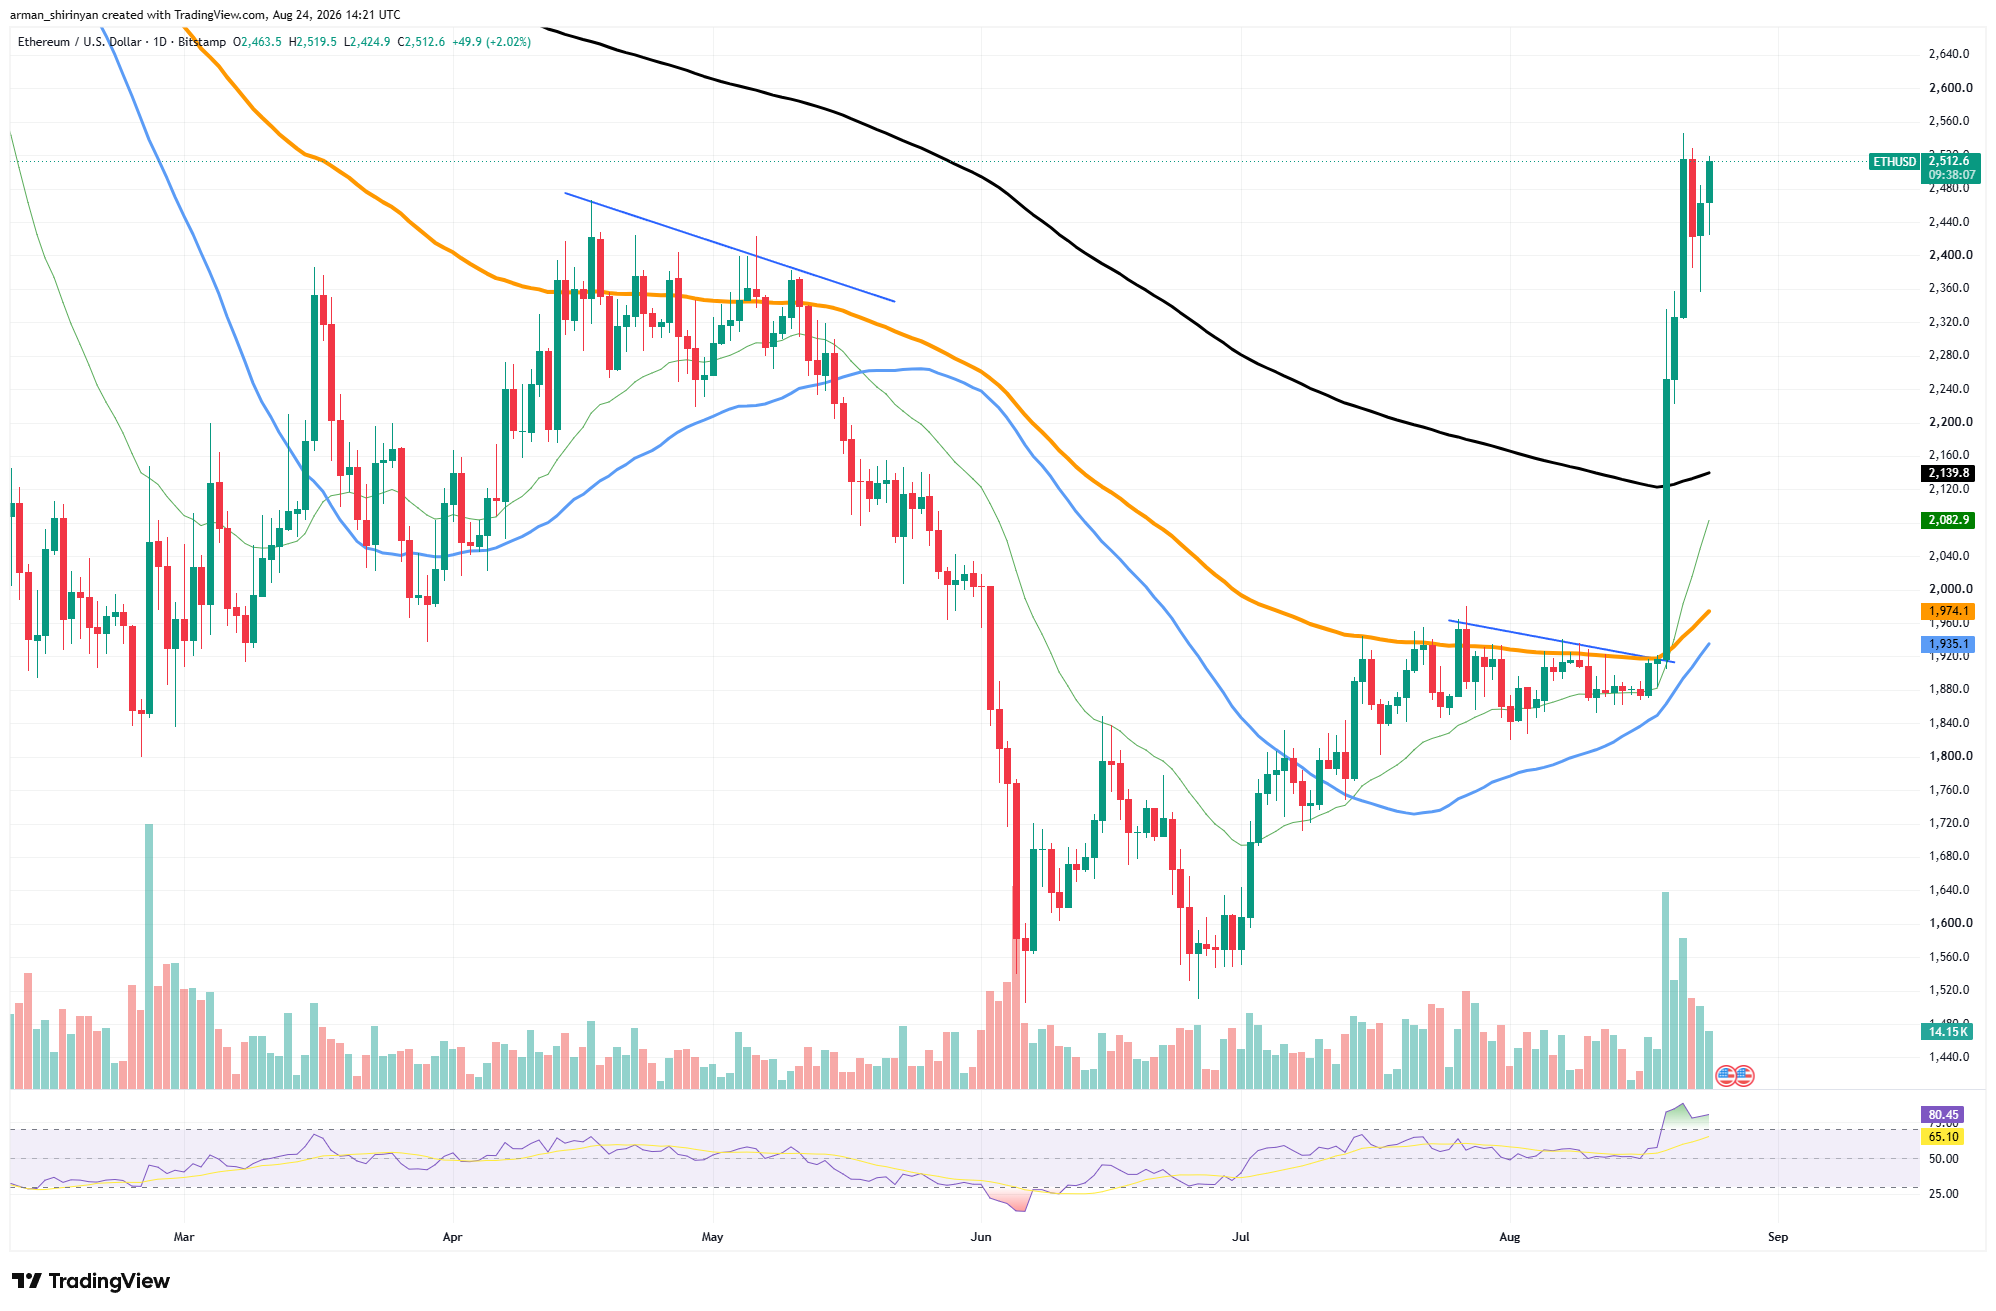
According to the daily chart, Ethereum has now recovered all of the major moving averages. The biggest technical barrier, the long-term average around $2,140, has been decisively crossed. Shorter averages continue to be significantly lower at $1,934, $1,974, and $2,082, forming a significant support structure below the current price.
Additional confirmation is provided by volume. One of the biggest volume spikes seen since February coincided with the first breakout candle, indicating that significant market participation rather than thin liquidity supported the move. Nevertheless, the same acceleration causes a temporary issue. Ethereum is now firmly in overbought territory as the daily RSI has reached about 80.

Additionally, without creating much support between $2,150 and $2,400, ETH has increased by about 30% from its pre-breakout range. Therefore, even in a bullish continuation scenario, a correction or sideways consolidation would be typical. The most recent advance has momentarily halted at $2,500–$2,550, which is the immediate resistance.
A daily close above this region might reveal $2,600, with the $2,700–$2,800 range coming next. After that, $3,000 becomes technically feasible, which is an additional 20% increase over current prices. Ethereum should ideally defend $2,400 on shallow pullbacks in order to preserve the bullish structure.
The more crucial structural support lies between $2,140 and $2,200. $3,000 is still a reasonable medium-term goal rather than an impractical extension as long as ETH stays above that recovered long-term resistance zone.
Bitcoin Making a Comeback
Although Bitcoin has made a strong comeback toward $79,000, the pace of the move has made room for a significant short-term decline. Even though Bitcoin's technical structure has significantly improved, a return to the $70,000 range should not be discounted. After starting from the $63,000-$65,000 consolidation range, BTC is currently trading at about $78,700.
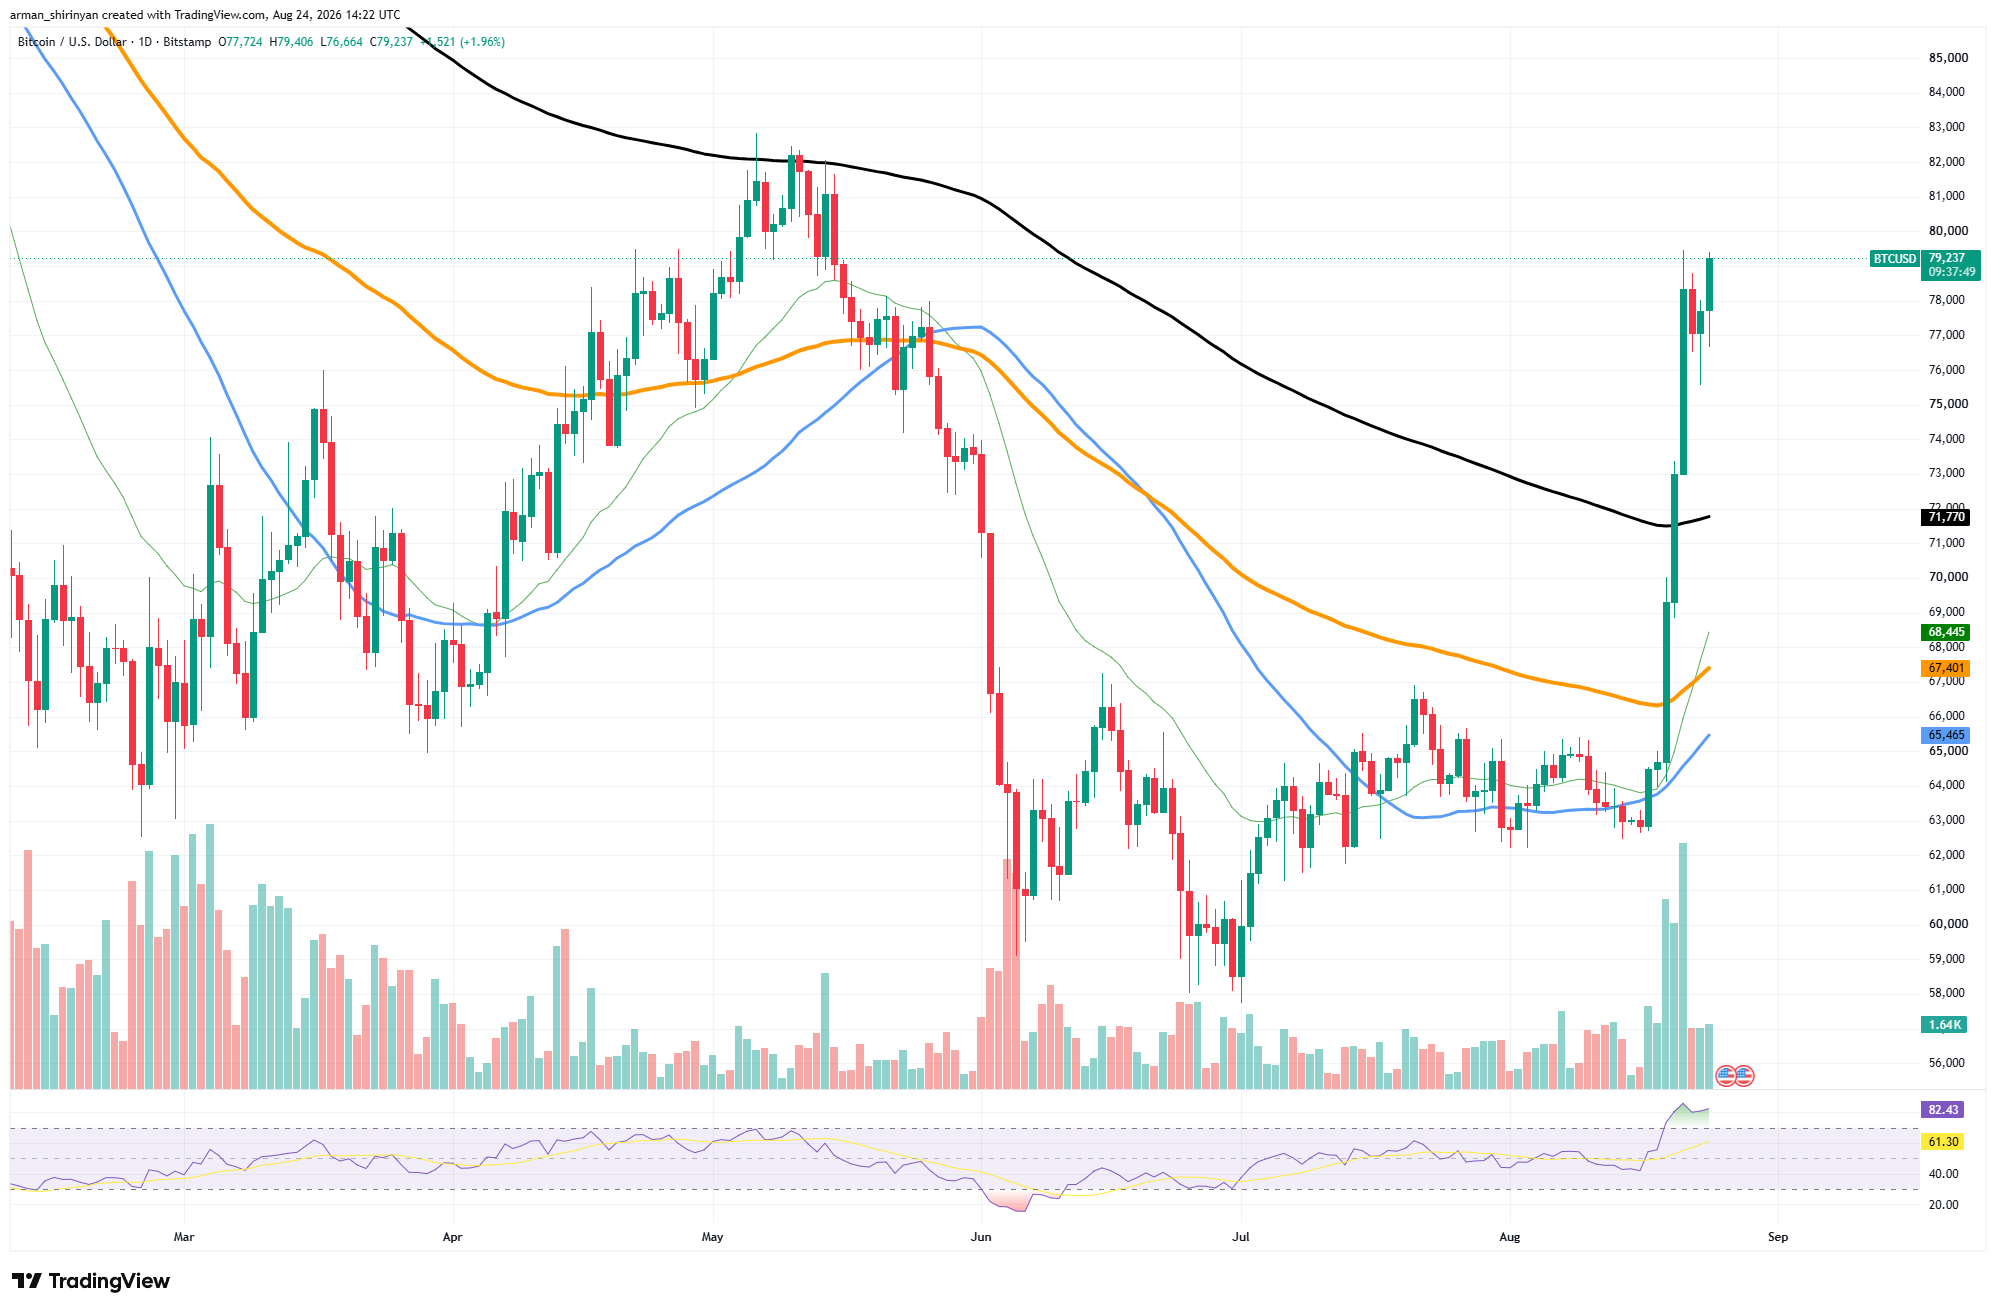
In just a few days, the breakout caused a significant increase in volume and propelled Bitcoin through multiple significant moving averages. Above all, Bitcoin recovered the long-term moving average at $71,765, which had served as resistance all summer. The medium-term picture is significantly improved by that breakout.
Nevertheless, without creating significant support between $72,000 and its current price, Bitcoin is currently almost 10% above this long-term average. Additionally, momentum appears stretched. The daily RSI is well within overbought territory, hovering around 82.
An elevated RSI shows that Bitcoin has moved significantly faster than its underlying trend, but it does not always indicate an immediate reversal, especially during strong breakout phases. The first support, which corresponds to the recent consolidation after the initial vertical move, is situated between $76,000 and $77,000.
Bitcoin may be able to challenge $80,000 and eventually reach the May high of about $82,000 if this area is maintained. However, the $71,000–$72,000 range would be the focus of a deeper correction. The long-term moving average is currently close to $71,765, making this area especially crucial.
Bitcoin could verify whether previous resistance has truly turned into support by conducting a retest. The $67,000–$68,500 cluster, which has multiple shorter moving averages, is another significant support zone below that. Therefore, Bitcoin's comeback would not necessarily be invalidated by a move toward $70,000.
A retest of the breakout area might actually result in a more robust technical structure following such a sharp increase from roughly $64,000 to nearly $80,000. If Bitcoin fell below $70,000 and then failed to regain the long-term moving average, that would be a more serious warning.
Shiba Inu May Have More Upside
Shiba Inu is demonstrating that, despite strong resistance near the long-term moving average, its most recent recovery may still have more room to grow. As a number of technical indicators continue to improve, SHIB is currently trading close to $0.00000543, holding onto the majority of the gains made during its most recent breakout.
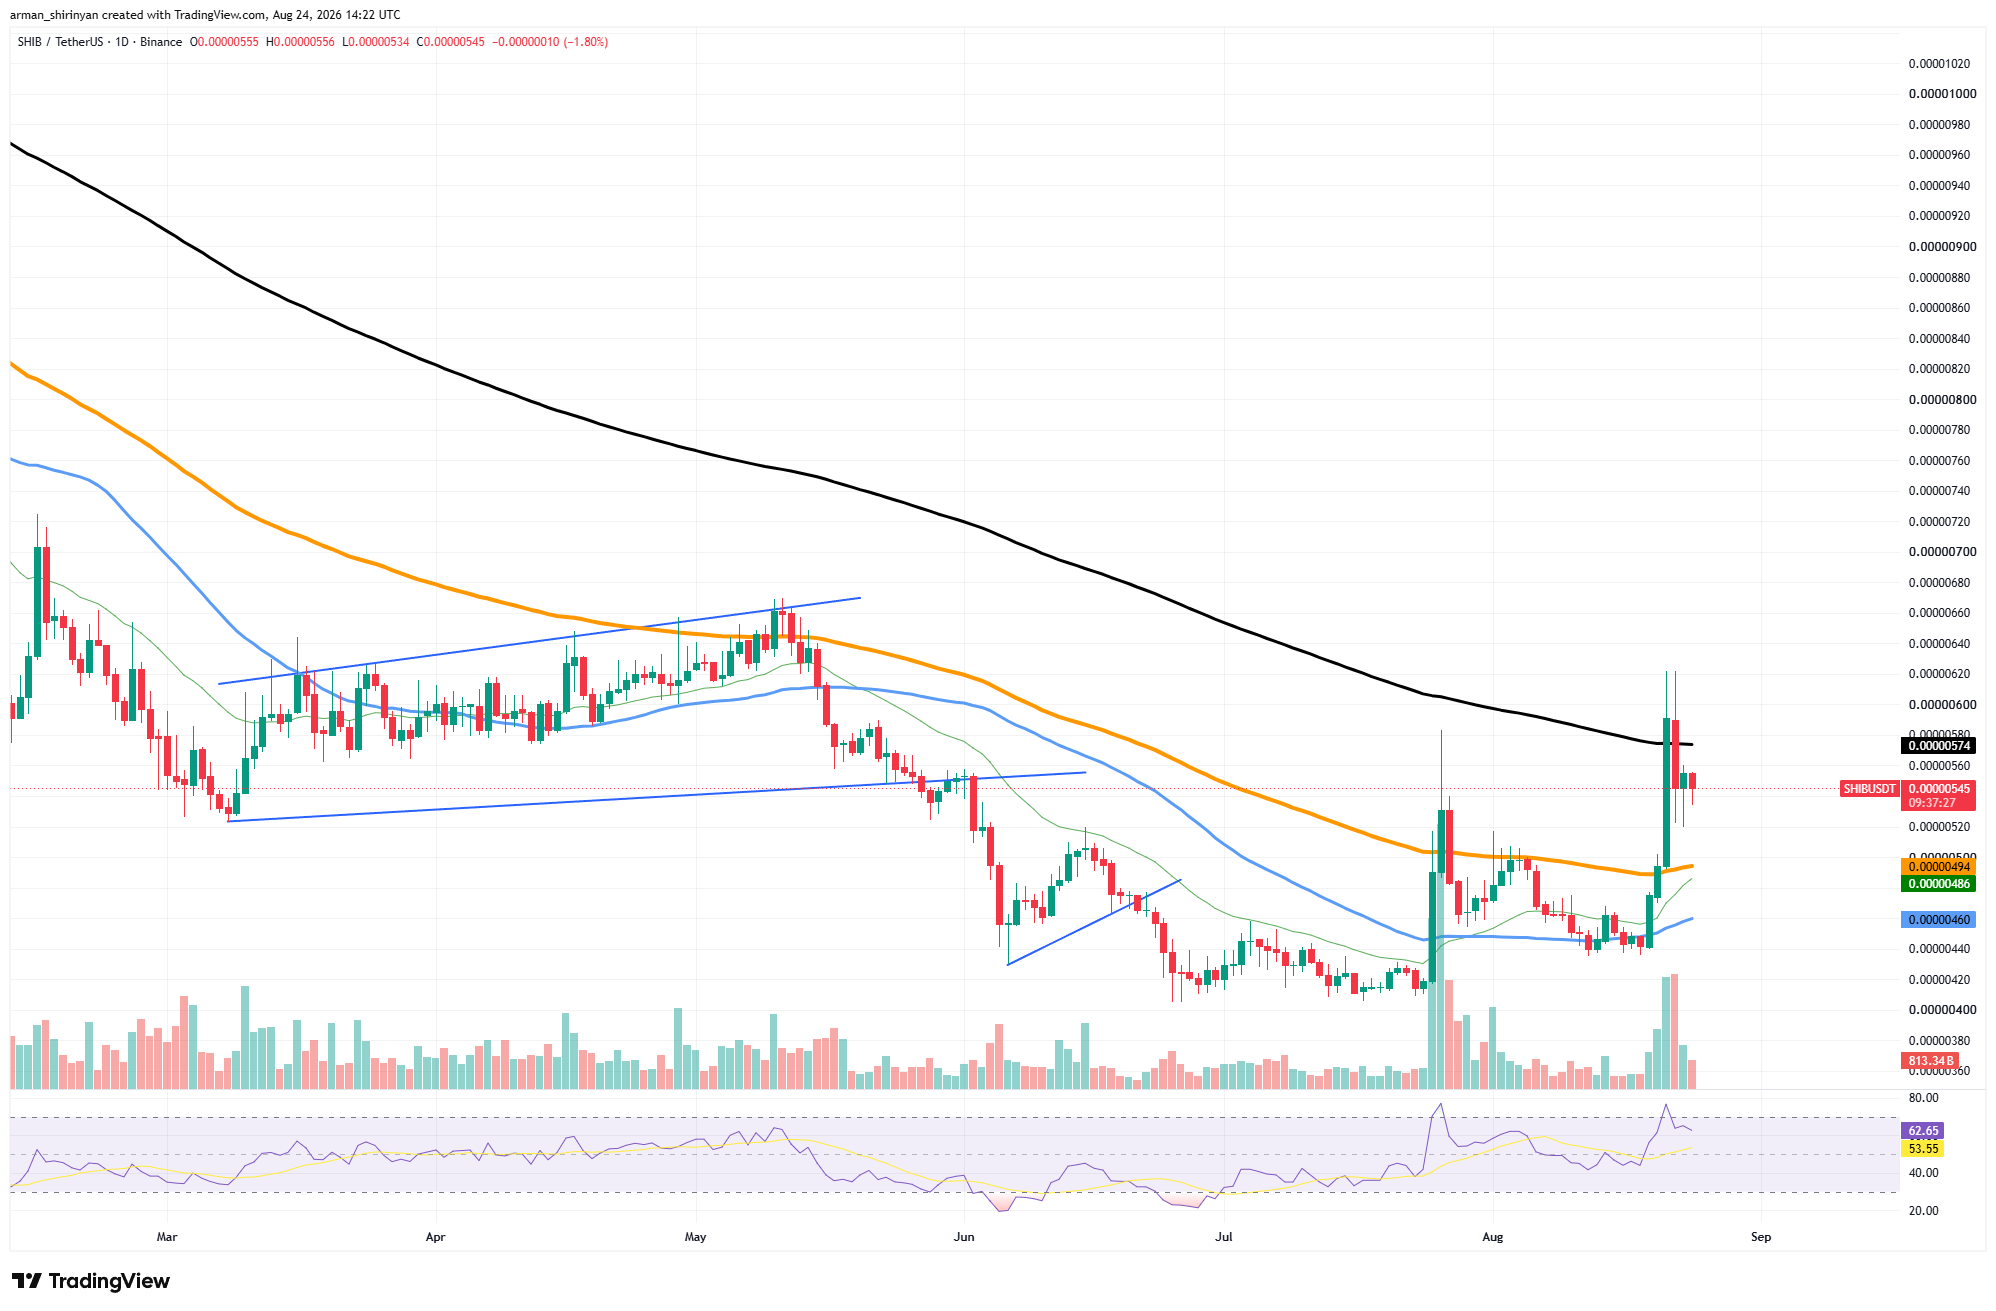
The most significant development occurred when SHIB surged from roughly $0.00000445 to momentarily reach $0.00000620. The token was pushed through its short- and medium-term moving averages almost instantly by that move, which carried significant volume. The long-term moving average at $0.00000574, however, was directly hit by the rally.
SHIB produced a long upper wick and subsequent correction after briefly trading above it but failing to gain a daily foothold. This indicates that the main resistance zone is between $0.00000570 and $0.00000600. The recovery is not necessarily threatened by the rejection itself. SHIB is still above the orange moving average near $0.00000494, while the shorter averages are located at roughly $0.00000486 and $0.00000460.

SHIB has created a significant technical buffer above a number of trend indicators for the first time in months. Another attempt is supported by momentum. The RSI is currently at about 62, which is lower than the overbought readings produced during the initial spike.
Another attack on $0.00000574 becomes feasible after that. $0.00000600–$0.00000620 would be exposed by a confirmed breakout above the long-term moving average, with the May resistance at $0.00000650 coming next. If SHIB loses $0.00000520, the negative scenario begins. The most crucial immediate support in that scenario is $0.00000490.
If that level is lost, the breakout will be significantly weakened and SHIB may return to $0.00000460. Although SHIB has not yet fully reversed its trend, its structure has undoubtedly improved. A further push above $0.00000574 would offer much more convincing proof that buyers desire more than a short-term respite.
 Dan Burgin
 U.Today Editorial Team
