
Disclaimer: The opinions expressed by our writers are their own and do not represent the views of U.Today. The financial and market information provided on U.Today is intended for informational purposes only. U.Today is not liable for any financial losses incurred while trading cryptocurrencies. Conduct your own research by contacting financial experts before making any investment decisions. We believe that all content is accurate as of the date of publication, but certain offers mentioned may no longer be available.
After a powerful multi-week push, Hyperliquid is attempting to stabilize, but the structure is currently mixed rather than clearly bullish.
The recovery is yet to come
After rejecting from the mid-$40s, the price is currently hovering around the $40–$41 range. More significantly, it is testing the stability of its rising trendline. It's the core of the current uptrend, as that trendline has defined the recovery phase since March.
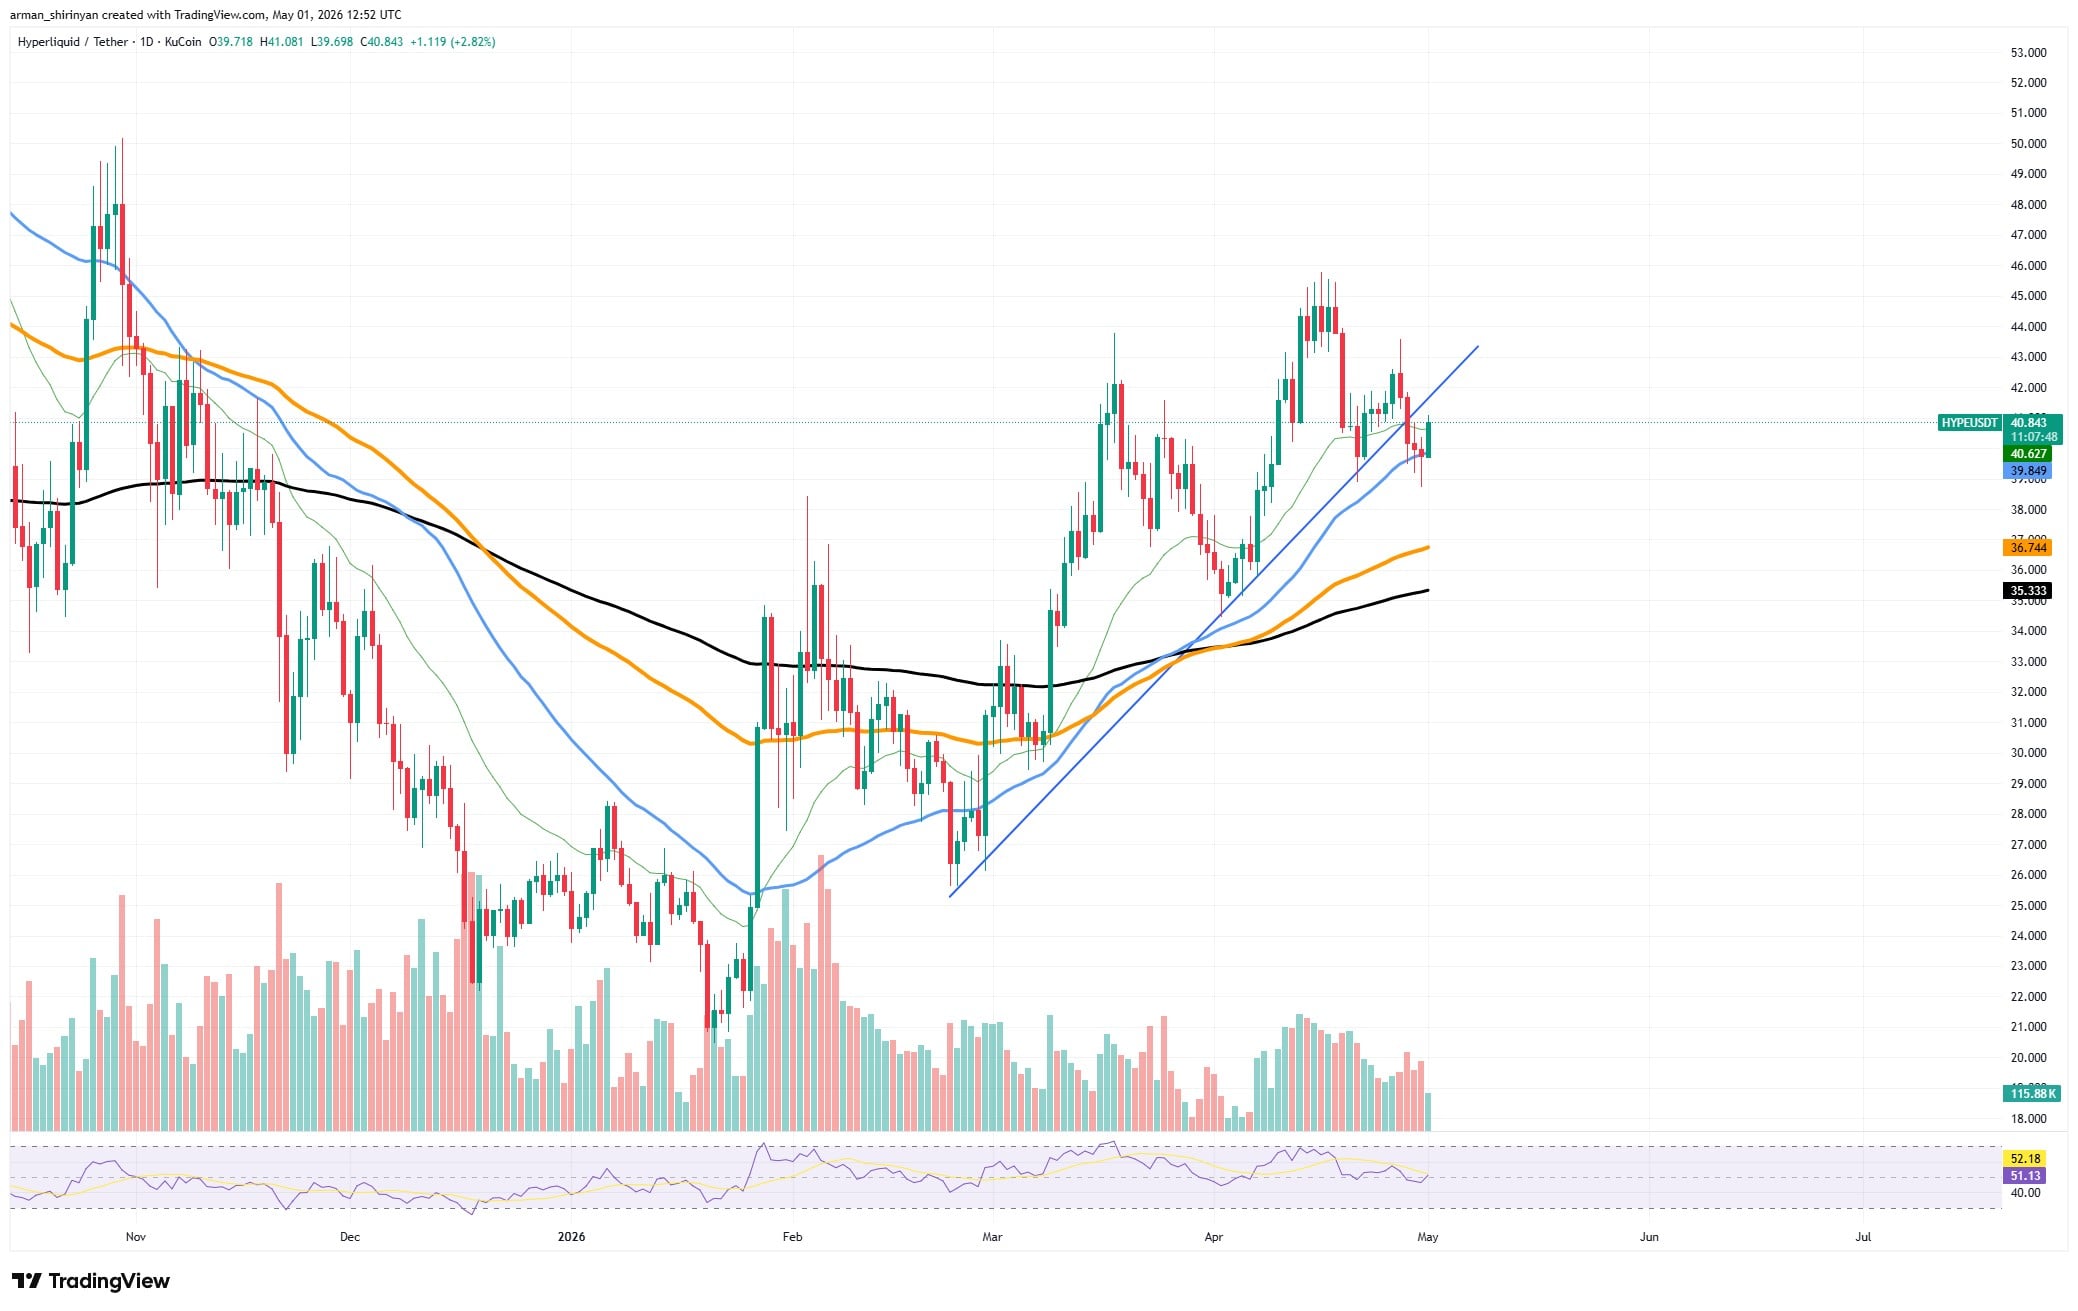
The asset is still above its mid-term moving averages from a technical perspective, maintaining the larger recovery. Sellers are active at higher levels, though, as evidenced by the repeated rejections around $44-$46. In contrast to the earlier leg up, momentum is clearly losing strength, cooling off rather than collapsing.
Derivatives data is where things become more intriguing. With short-term inflows spiking sharply and occasionally pushing well above 100% net change, futures flows exhibit sharp acceleration. There is a noticeable positive net inflow on shorter time intervals (5–30 minutes), indicating that capital is swiftly entering derivatives markets. Such actions typically indicate an increase in speculative interest.
Net flows flip
The structure isn't one-sided, though. Higher timeframe data (such as the 4-hour window) reveals periods of negative net flow, indicating that capital is also departing equally quickly, even though short-term flows are positive. This discrepancy suggests a volatile leveraged environment, as opposed to consistent accumulation.
That perspective is supported by liquidation data. Bursts of short selling are occurring, but long liquidations are also continuing. This results in a two-sided market where both directions are penalized, which is more indicative of a transitional stage than the continuation of a trend.

The long/short ratios are also informative. Top traders exhibit a more balanced, or even long-leaning, stance, whereas retail positioning leans slightly short on some exchanges. Instead of smooth directional movements, that split typically causes volatility spikes.
The simple lesson for investors is that this is not a clear-cut breakout environment. The bounce is not assured, but it is possible, particularly if the rising trendline holds and the short pressure keeps waning. If HYPE loses the $39-$40 support zone, the structure breaks and begins to move toward the $36 area. Another push toward $45 is likely if it holds and convincingly reclaims $42.
 Dan Burgin
 U.Today Editorial Team