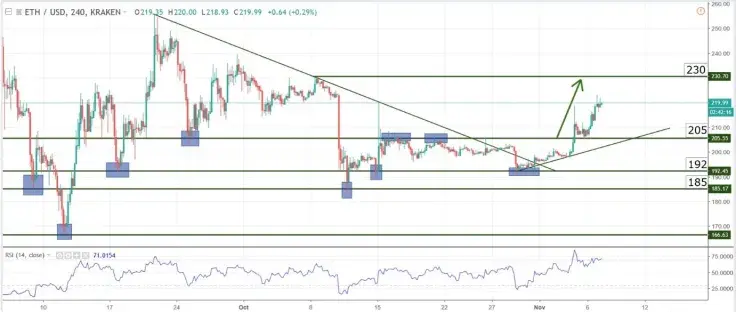
ETH has been stuck inside a horizontal channel (between $205 and $192) for a relatively long time and as I’ve predicted, once that channel broke price continued in the direction of the breakout. The move higher can be attributed to a recent surge in volume for the entire crypto market but also to positive sentiment that surrounds Ethereum itself. Sentiment for the world's most advanced blockchain began to improve immediately following the Serenity (aka Ethereum 2.0) roadmap reveal during the Devcon4 conference in Prague.
Charts at a Glance

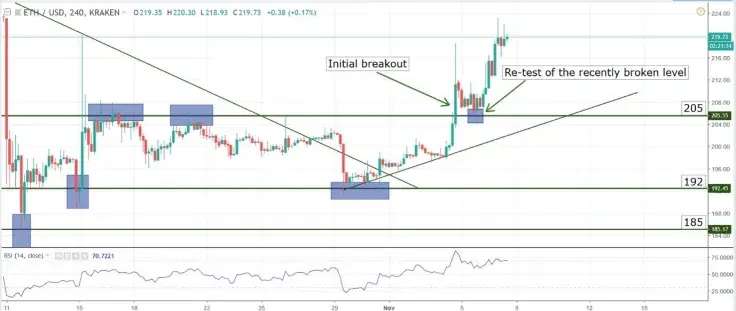
During the last 24 hours, ETH/USD has climbed 3.19% and a solid 11.26% during the last 7 days. In the process, the pair has escaped the channel topped by the $205 level and also re-tested the broken level, turning it into support.
A re-test is usually seen after a breakout, when price returns to the recently broken level and then bounces once again in the direction of the breakout. At that point is typical to see prices surpassing the initial post-break out high. That price action sequence is perfectly exemplified by the ETH/USD pair:

The next target is most likely the resistance at $230 but given that price action is overextending, and the Relative Strength Index is in overbought territory and shows bearish divergence, we expect a retracement lower before significant advances can be made.
Support zone: 205
Resistance zone: 230
Most likely scenario: move closer to 230, followed by retracements lower
Alternative scenario: stagnation with a bearish bias (long wicked candles show possible end of the
 Caroline Amosun
 Godfrey Benjamin
 Tomiwabold Olajide